At Allegion, we are pioneering safety by protecting people where they live, learn and work and safeguarding our environment at the same time. We promote the health and safety of our employees, customers and local community members worldwide through our commitment to conducting business in a safe and environmentally responsible manner.
Recent progress
Click on our recent milestones below for more information.
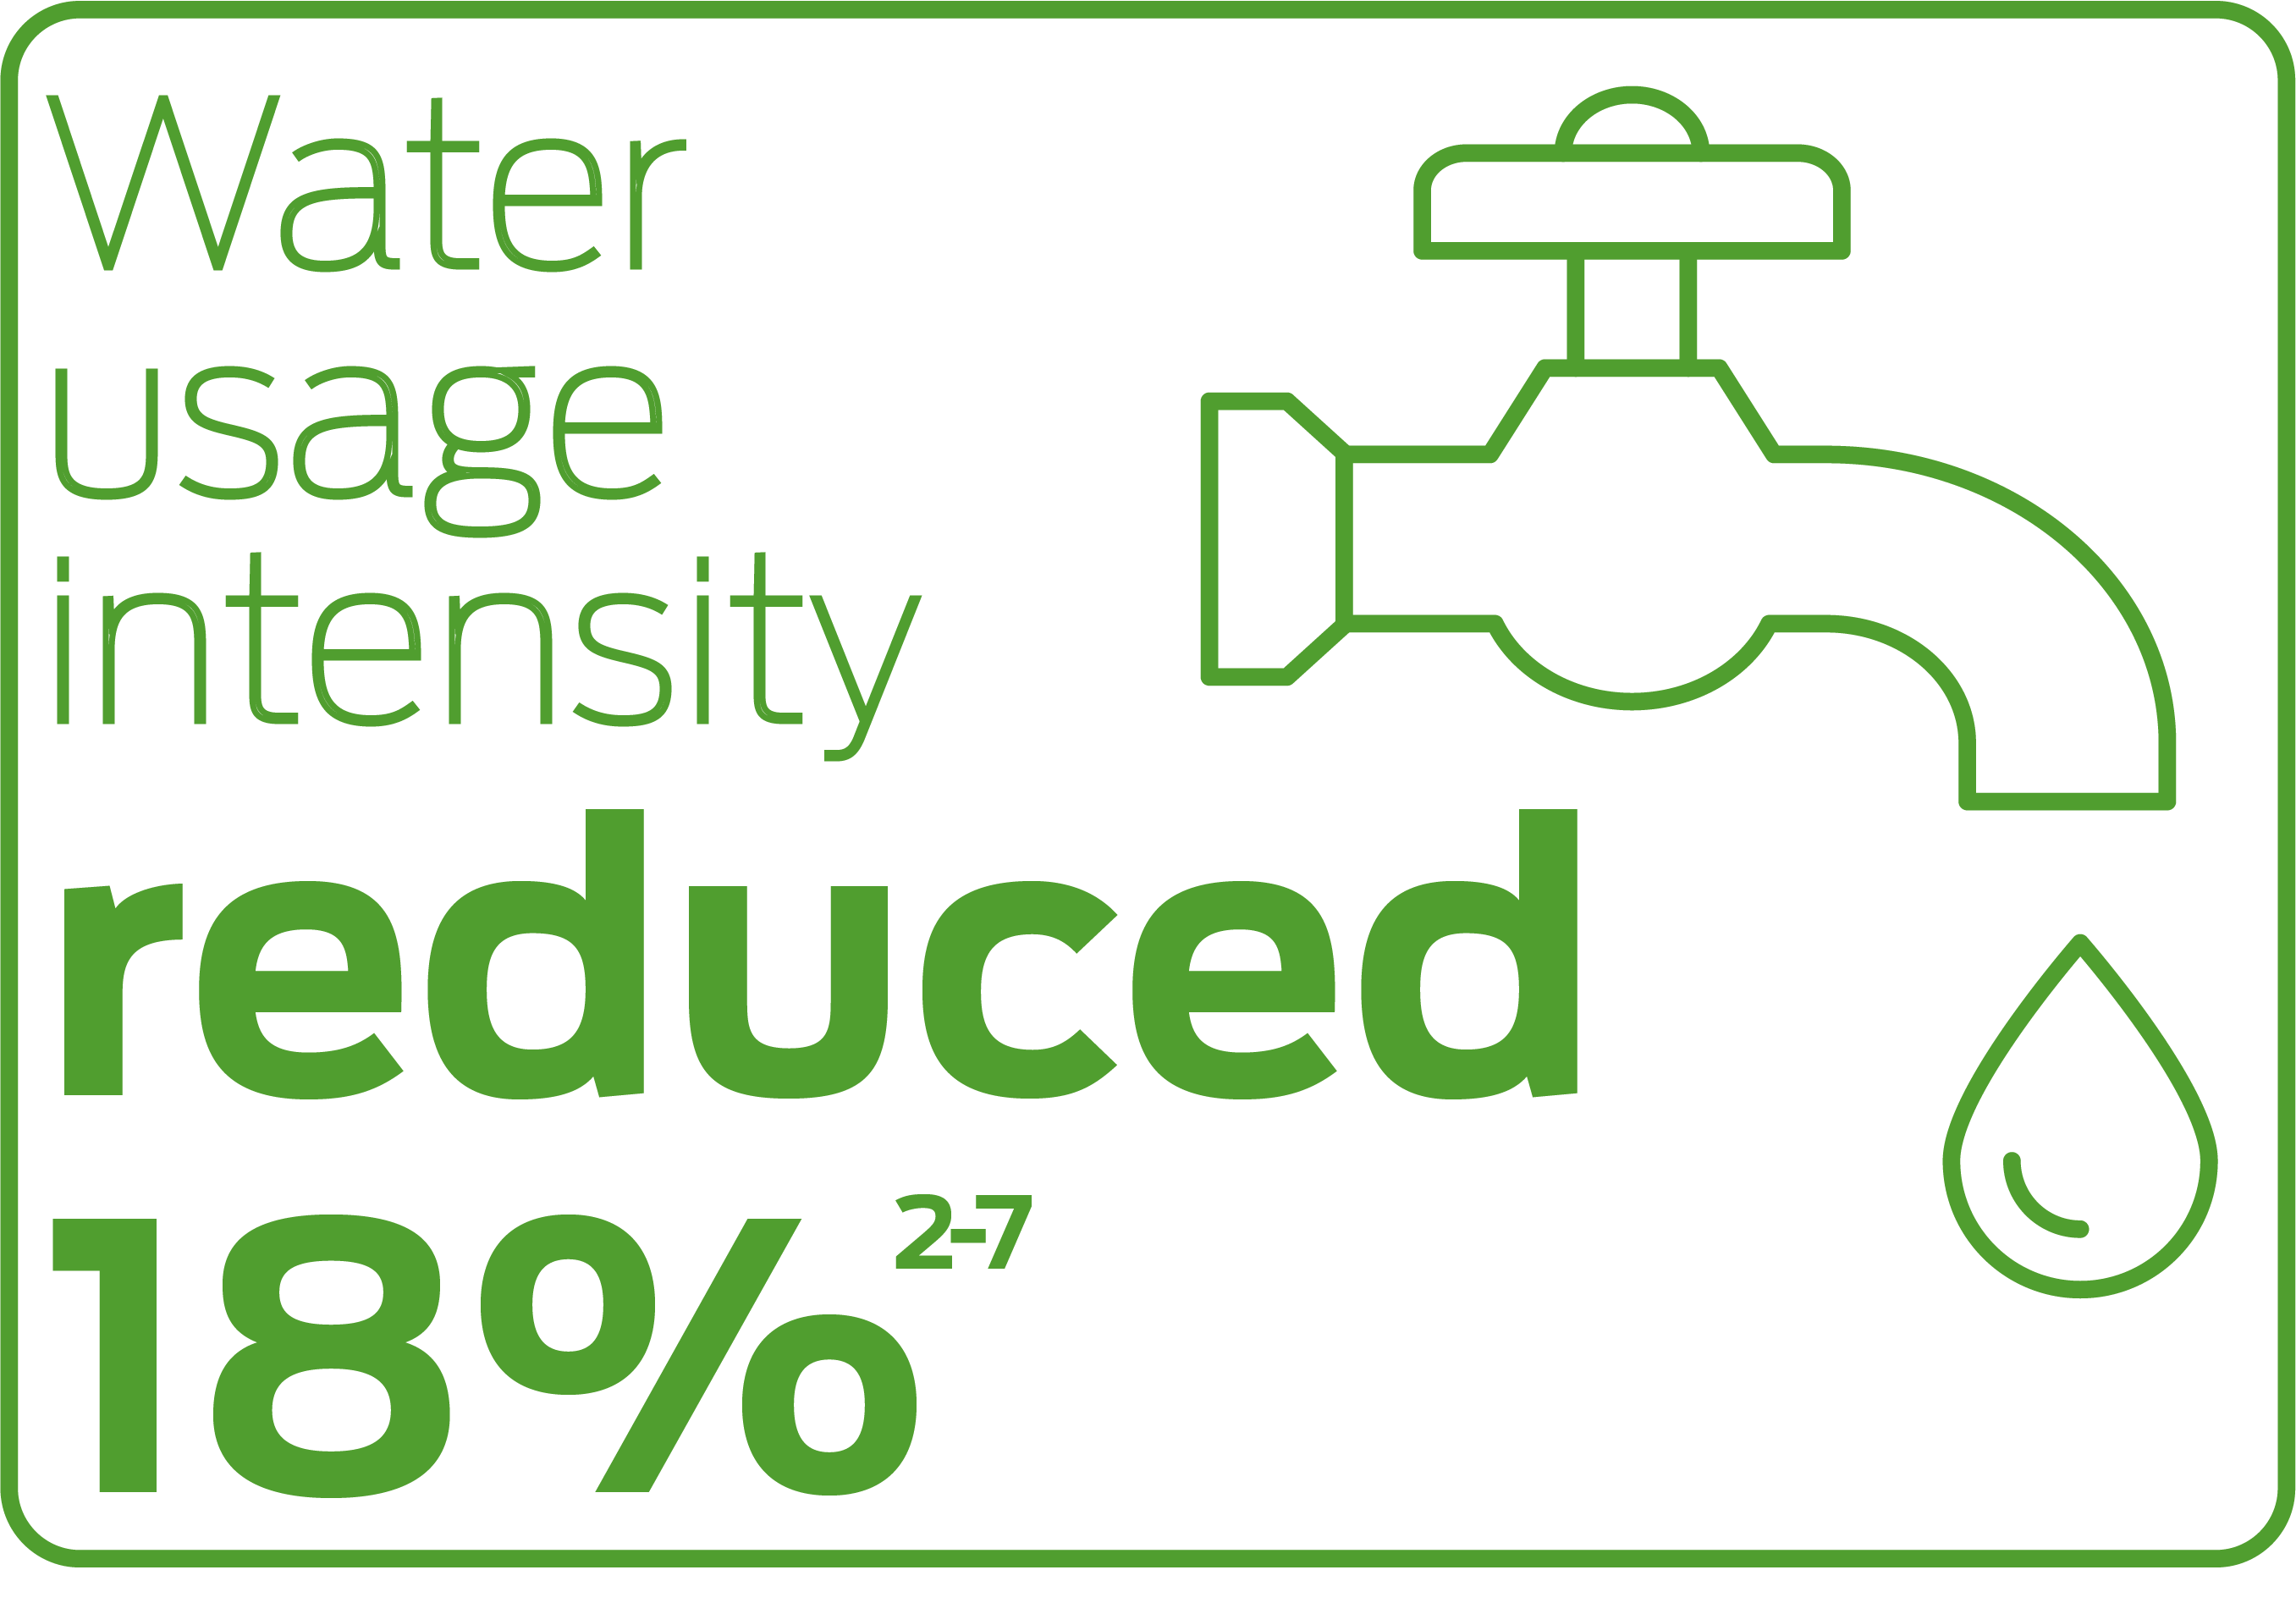
Water usage intensity reduced 18%
As of Dec. 31, 2024, Allegion reduced its water usage intensity by 18% compared to our 2020 baseline year. By 2030, we aim to use 20% less water than we did in 2020.
In our ESG Goals & KPIs section, you’ll find year-over-year data for both normalized data and the actual volume of water used. While volume may vary due to factors such as production output, active hours or the number of sites we operate, normalized data allows us compare "apples-to-apples."
2 Data is normalized to hours worked. To the extent actual hours worked are not available for any full-time employee, an average of 40 hours per week is used.
3 Actual data is collected for production, assembly and distribution facilities and certain warehouses globally. For all other facilities, data is estimated based on the assumptions below:
- 15 gallons (or 57 liters) of water used per employee per workday.
- 2,700 British Thermal Units of natural gas usage and 1.5 kilowatt hours of electricity usage per square footage per month for office type facilities.
- 2,000 British Thermal Units of natural gas usage and 0.6 kilowatt-hours of electricity per square footage per month for all other facility types.
- 40 pounds (18 kilograms) of non-hazardous waste per employee per month.
4 Data associated with activities not related with production, assembly or distribution are excluded.
5 Data associated with acquisitions is included within values presented starting the year following acquisition.
6 Data associated with the majority of fleet fuel usage has not been included.
7 Data and metrics associated with the manufacturing and field service activities of Stanley Access Technologies is included in 2024 values (excluding the field service activities of Stanley Access Technologies, LTIR and TRIR were 0.12 and 0.44 for 2024). For 2023, only the manufacturing activities of Stanley Access Technologies are included. Baseline year 2020 has not been adjusted.
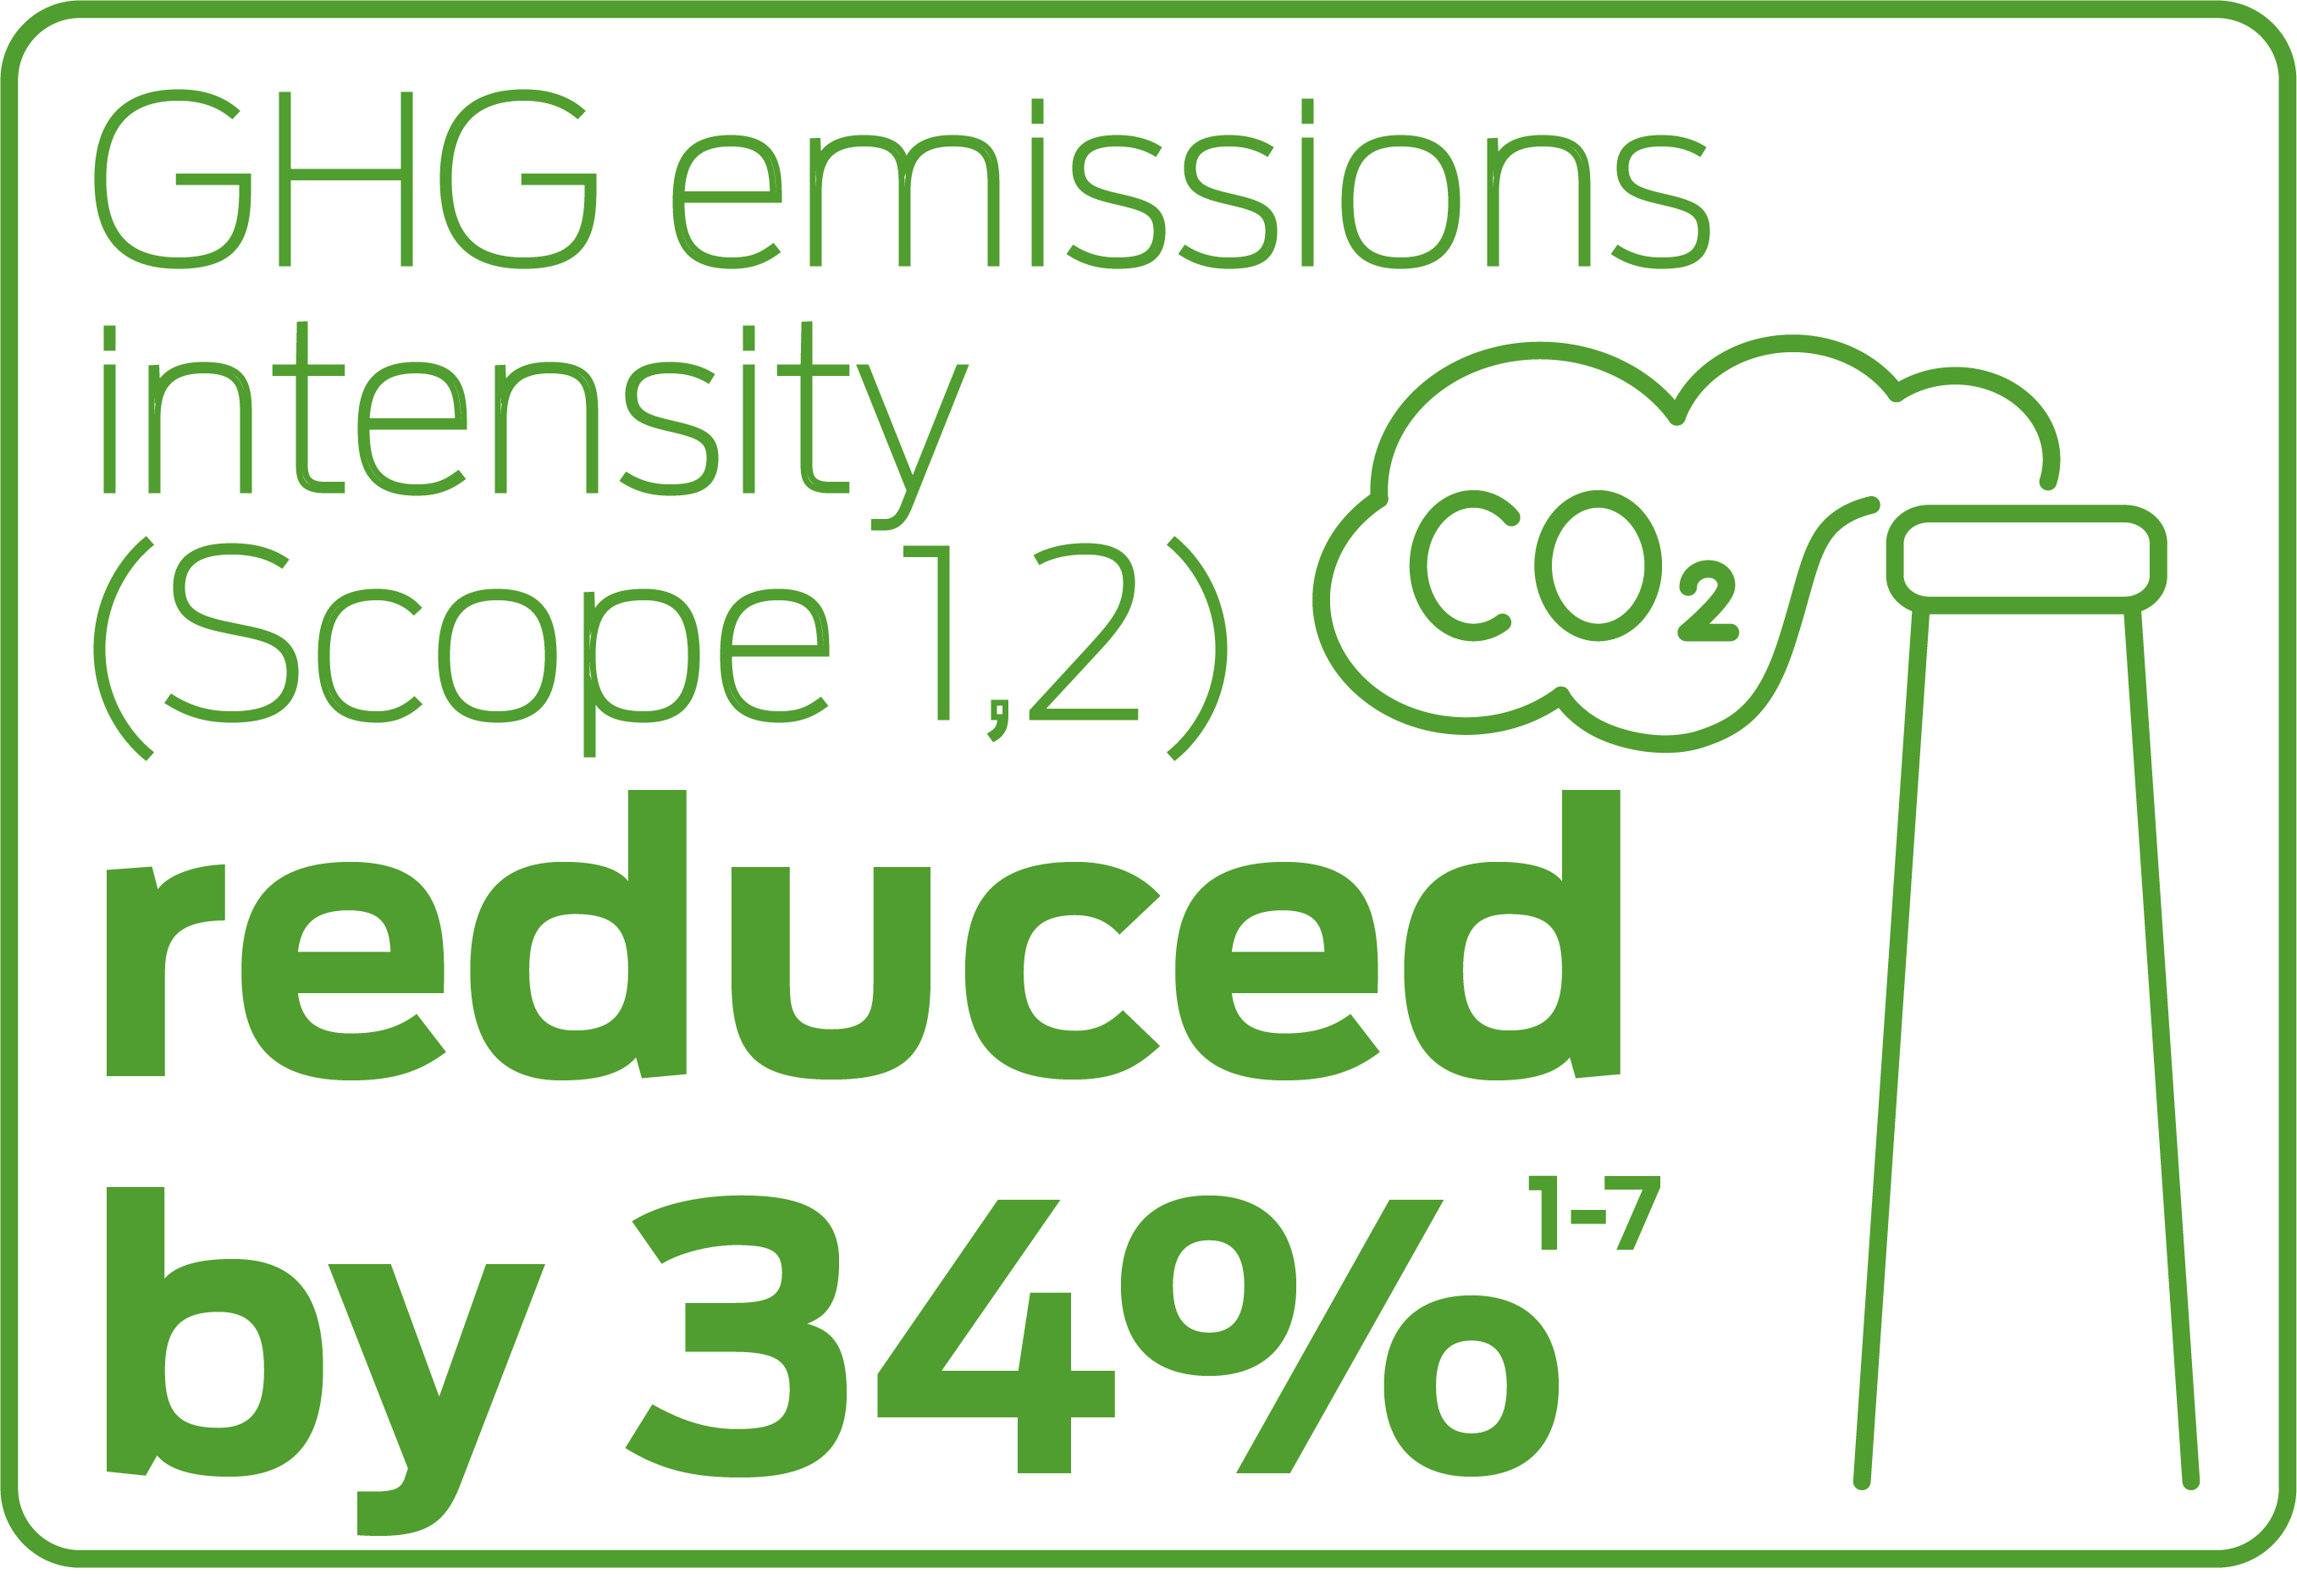
GHG emissions intensity (Scope 1,2) reduced by 34%
As of Dec. 31, 2024, Allegion reduced its greenhouse gas (GHG) emissions intensity (Scope 1 and Scope 2) by 34% compared to our 2020 baseline year. By 2030, we aim to achieve a 40% reduction in GHG emissions intensity for Scope 1 and Scope 2 emissions.
In 2024, Allegion increased its GHG emission intensity (Scope 1 and Scope 2) target from 25% to 40% based on continued improvements in its operations.
Allegion aims to achieve carbon-neutral emissions globally by 2050, and we support the U.N. Sustainable Development Goal to take urgent action on climate change. We know that some communities need time to build necessary energy infrastructure to make this vision a reality. In the meantime, our company is pursuing incremental improvement targets, including meeting Allegion’s electricity needs with 100% carbon-free electricity by 2030 (that is, the energy is produced by a non-fossil fuel source that generates no carbon emissions), and achieving carbon neutrality at 50% of our current sites by 2035.
1 GHG emissions calculations previously used a set formula globally. Calculations have been revised for 2020 through 2024 to utilize available location specific grid data.
2 Data is normalized to hours worked. To the extent actual hours worked are not available for any full-time employee, an average of 40 hours per week is used.
3 Actual data is collected for production, assembly and distribution facilities and certain warehouses globally. For all other facilities, data is estimated based on the assumptions below:
- 15 gallons (or 57 liters) of water used per employee per workday.
- 2,700 British Thermal Units of natural gas usage and 1.5 kilowatt hours of electricity usage per square footage per month for office type facilities.
- 2,000 British Thermal Units of natural gas usage and 0.6 kilowatt-hours of electricity per square footage per month for all other facility types.
- 40 pounds (18 kilograms) of non-hazardous waste per employee per month.
4 Data associated with activities not related with production, assembly or distribution are excluded.
5 Data associated with acquisitions is included within values presented starting the year following acquisition.
6 Data associated with the majority of fleet fuel usage has not been included.
7 Data and metrics associated with the manufacturing and field service activities of Stanley Access Technologies is included in 2024 values (excluding the field service activities of Stanley Access Technologies, LTIR and TRIR were 0.12 and 0.44 for 2024). For 2023, only the manufacturing activities of Stanley Access Technologies are included. Baseline year 2020 has not been adjusted.
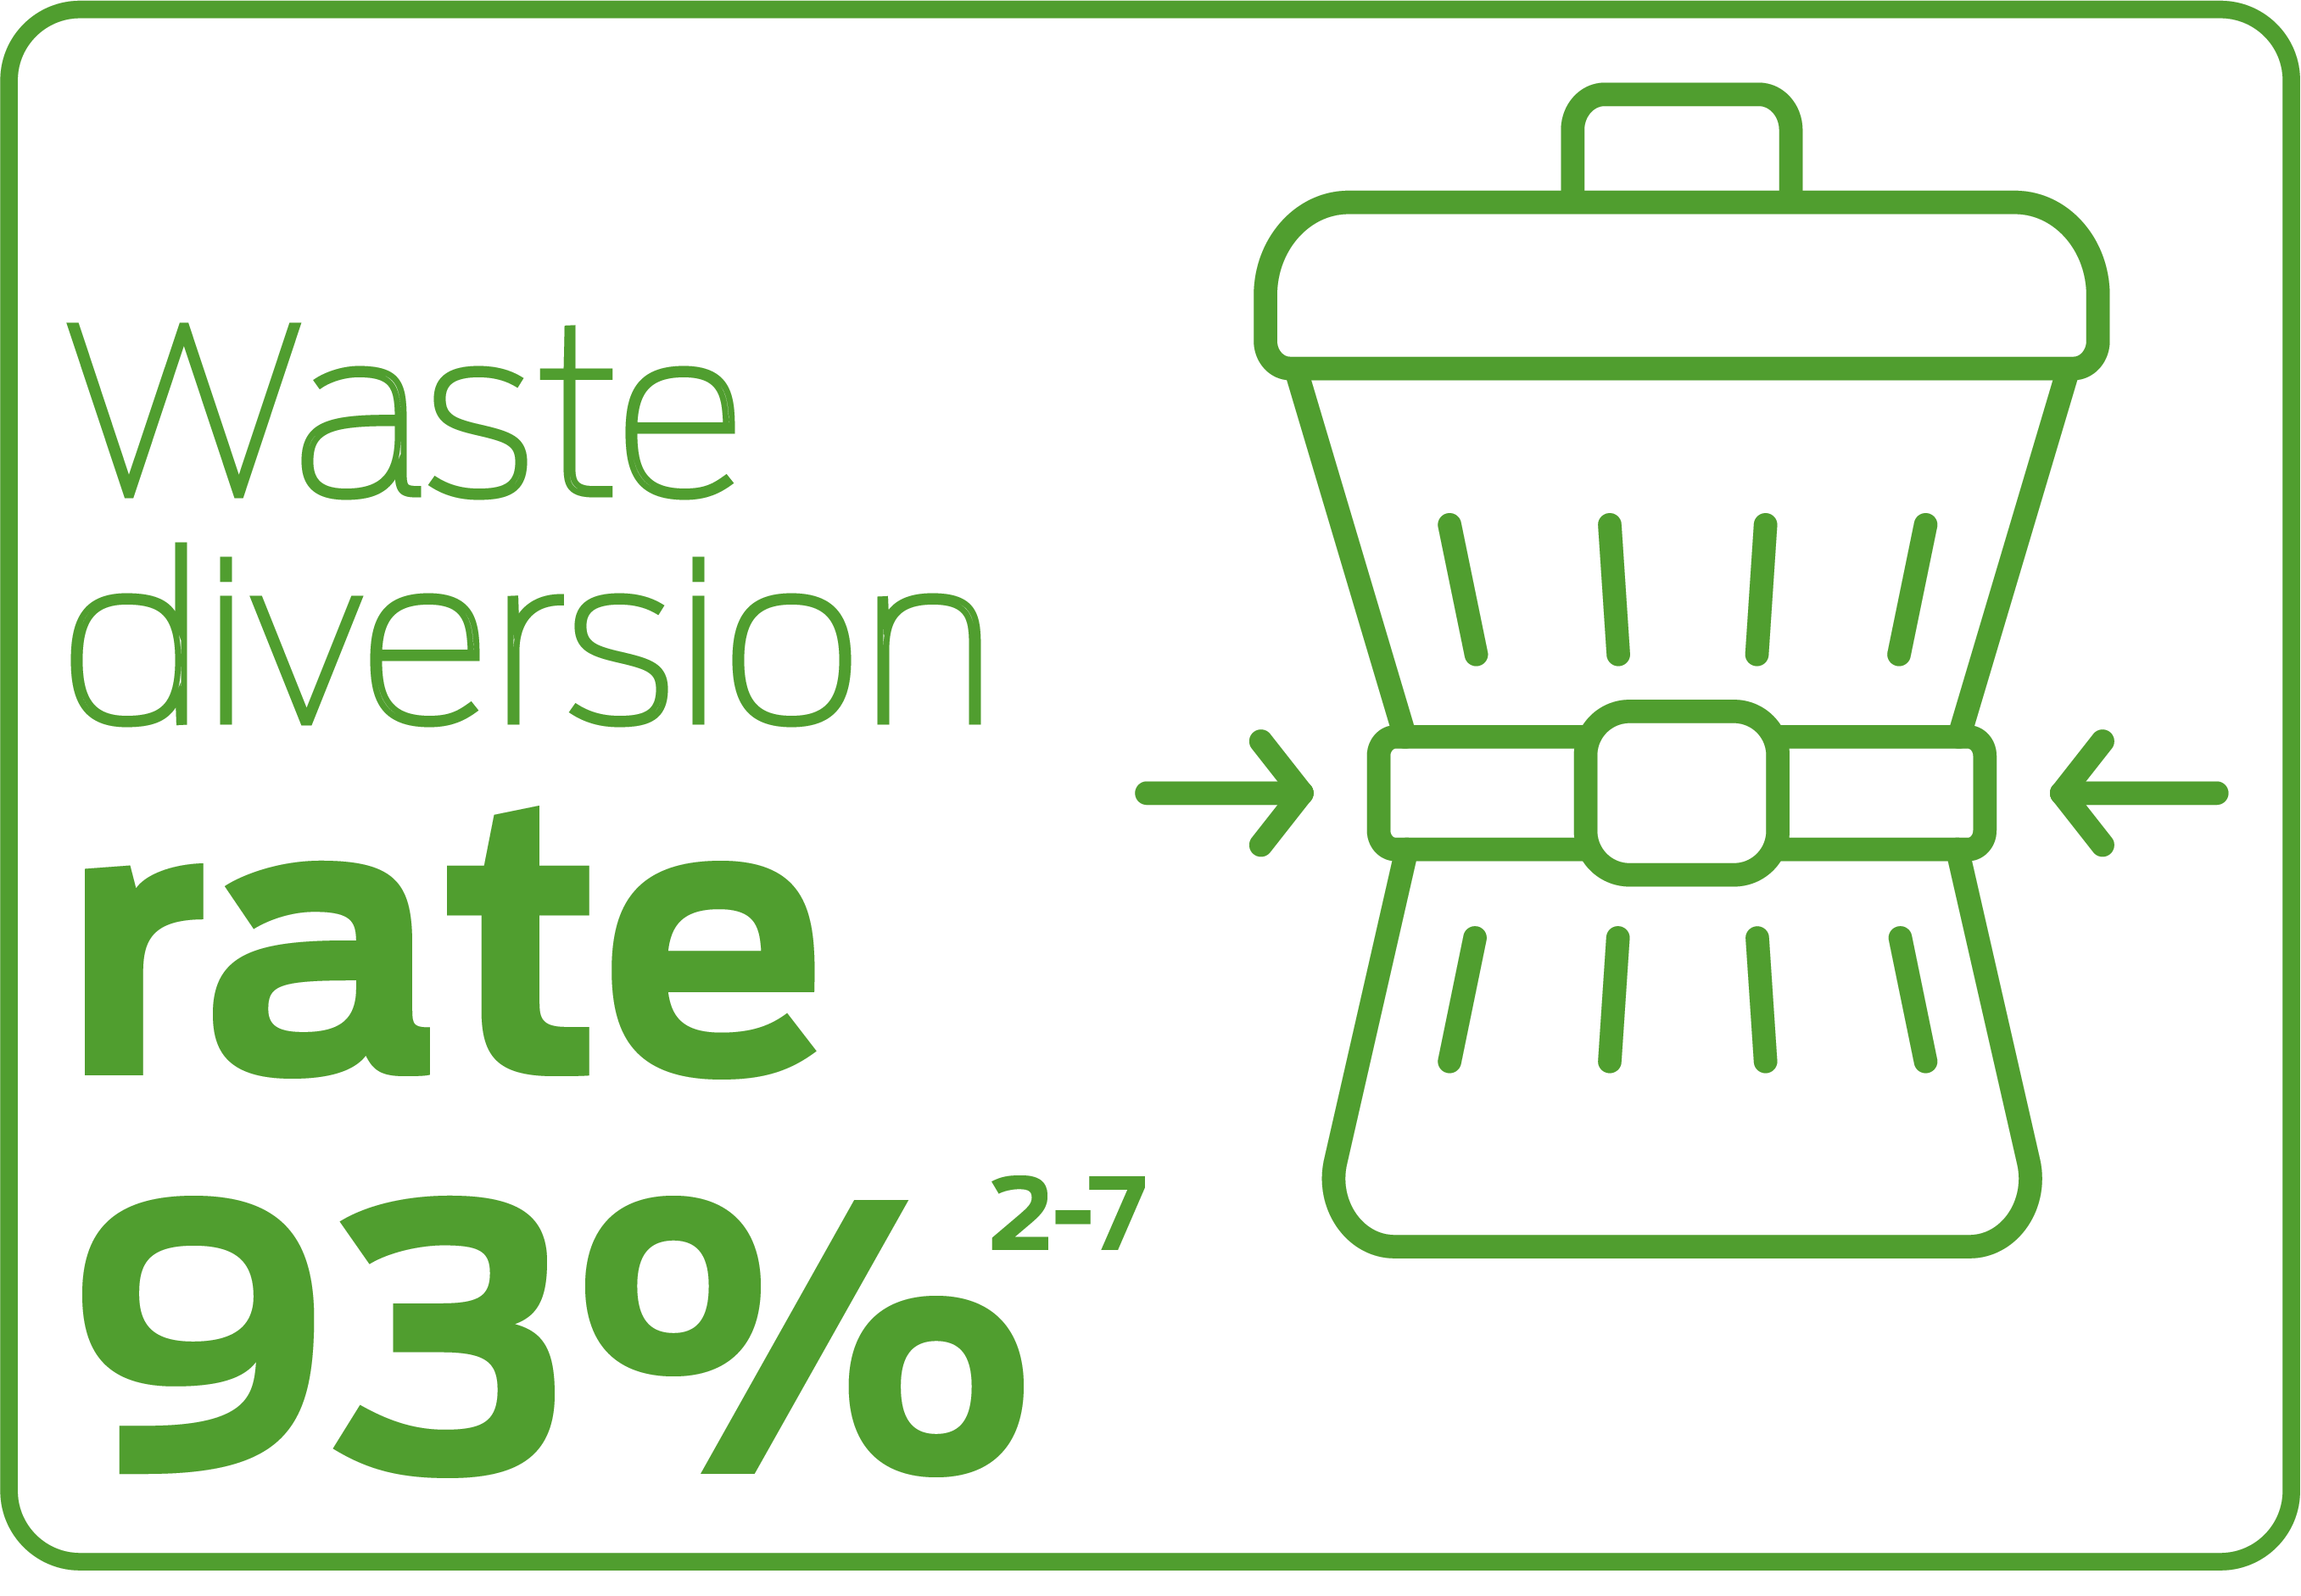
Waste diversion rate 93%
The waste diversion (from landfill) rate is an essential metric for evaluating environmental performance because it reflects an organization's commitment to sustainability and resource conservation. Waste diversion reduces the environmental impact associated with waste disposal, such as greenhouse gas emissions, soil and water pollution and depletion of natural resources.
By measuring waste diversion rate, organizations can track their progress in reducing waste generation and promoting circular economy principles. It encourages the implementation of effective waste management strategies, such as source reduction, recycling programs and alternative treatment initiatives. A high waste diversion rate demonstrates a commitment to responsible practices, serves as a valuable indicator of environmental performance and can enhance an organization's reputation and stakeholder trust.
2 Data is normalized to hours worked. To the extent actual hours worked are not available for any full-time employee, an average of 40 hours per week is used.
3 Actual data is collected for production, assembly and distribution facilities and certain warehouses globally. For all other facilities, data is estimated based on the assumptions below:
- 15 gallons (or 57 liters) of water used per employee per workday.
- 2,700 British Thermal Units of natural gas usage and 1.5 kilowatt hours of electricity usage per square footage per month for office type facilities.
- 2,000 British Thermal Units of natural gas usage and 0.6 kilowatt-hours of electricity per square footage per month for all other facility types.
- 40 pounds (18 kilograms) of non-hazardous waste per employee per month.
4 Data associated with activities not related with production, assembly or distribution are excluded.
5 Data associated with acquisitions is included within values presented starting the year following acquisition.
6 Data associated with the majority of fleet fuel usage has not been included.
7 Data and metrics associated with the manufacturing and field service activities of Stanley Access Technologies is included in 2024 values (excluding the field service activities of Stanley Access Technologies, LTIR and TRIR were 0.12 and 0.44 for 2024). For 2023, only the manufacturing activities of Stanley Access Technologies are included. Baseline year 2020 has not been adjusted.
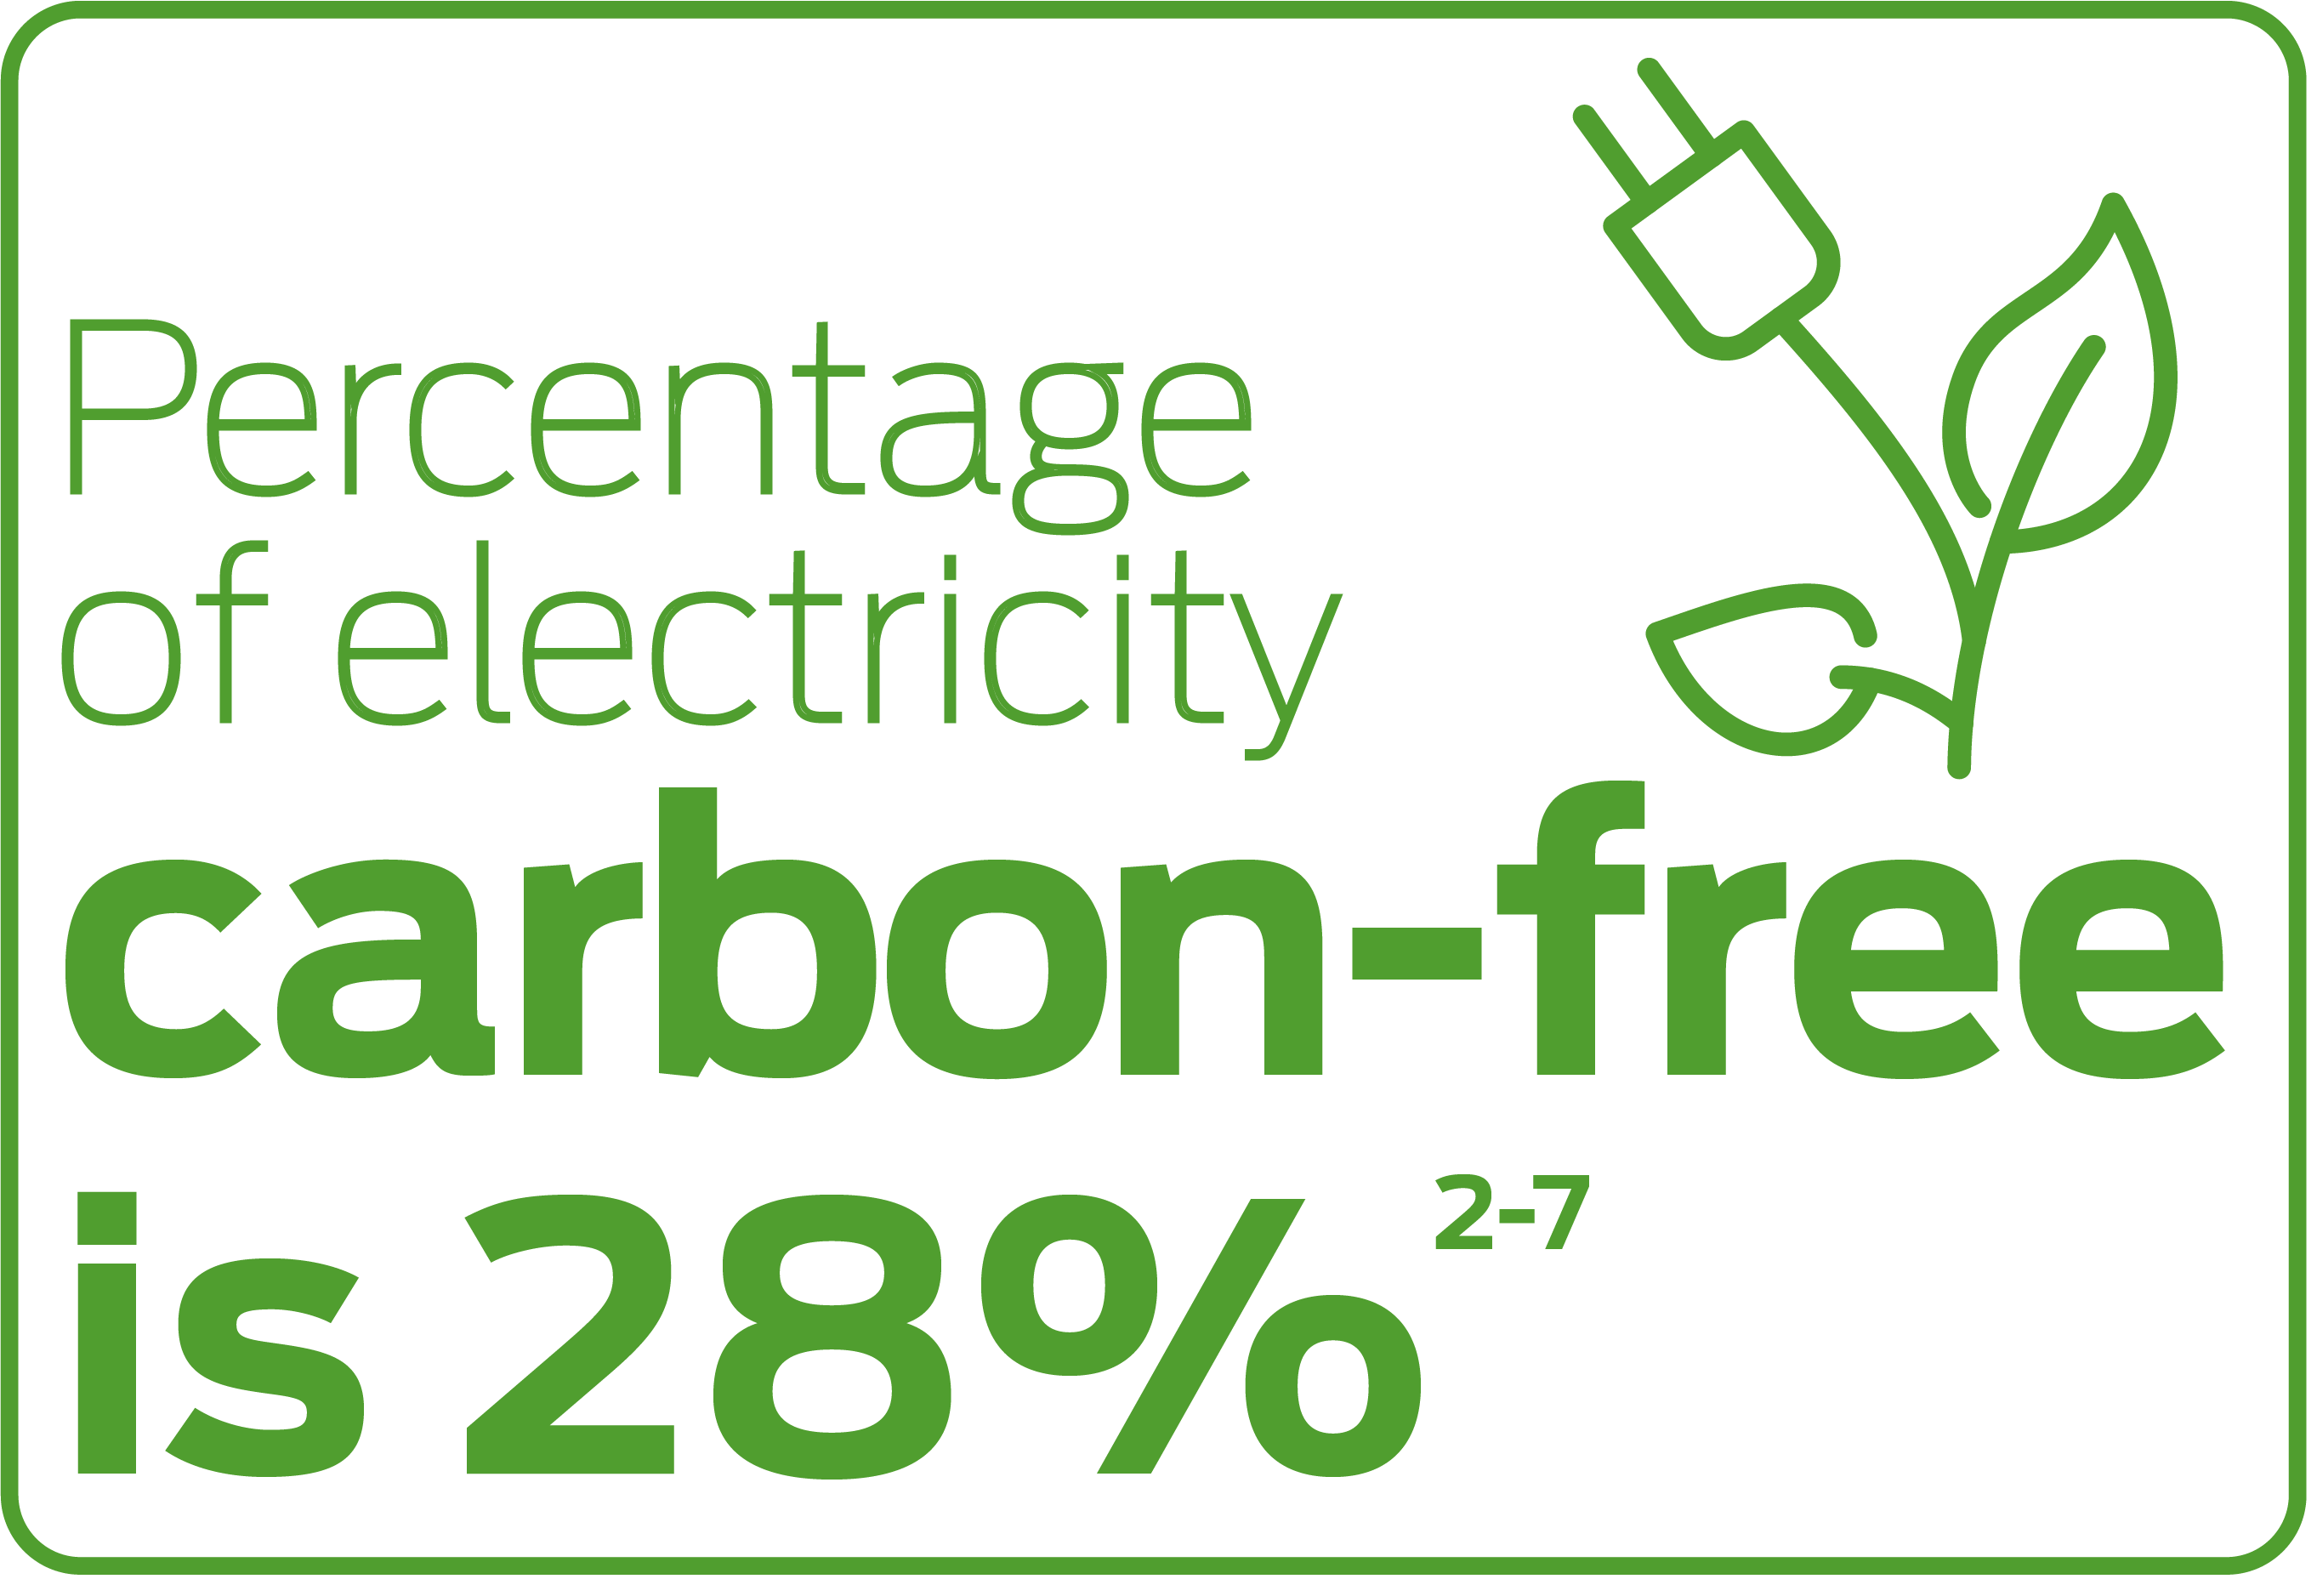
Percentage of electricity carbon-free is 28%
At Allegion, our use of electricity from carbon-free sources since 2020 has increased sevenfold. As of 2024, 28% of all electricity used at Allegion’s sites came from our 11 facilities globally that are operating entirely on carbon-free electricity, up from 4% in 20202-7.
A growing number of Allegion’s production and assembly facilities now meet all their electricity needs with carbon-free energy. The 11 sites that have fully transitioned to carbon-free electricity include: Veenendaal, Netherlands; Birmingham, U.K.; Perrysburg, Ohio; Snoqualmie, Washington; Aukland, New Zealand; McKenzie, Tennessee; Cincinnati, Ohio; Irving, Texas; Everett, Washington; Edmonton, Alberta; and Greenfield, Indiana.
These sites have partnered with clean energy utility companies to operate on 100% carbon-free electricity, resulting in significant cost reductions and the conversion of millions of kilowatt hours to clean energy annually.
2 Data is normalized to hours worked. To the extent actual hours worked are not available for any full-time employee, an average of 40 hours per week is used.
3 Actual data is collected for production, assembly and distribution facilities and certain warehouses globally. For all other facilities, data is estimated based on the assumptions below:
- 15 gallons (or 57 liters) of water used per employee per workday.
- 2,700 British Thermal Units of natural gas usage and 1.5 kilowatt hours of electricity usage per square footage per month for office type facilities.
- 2,000 British Thermal Units of natural gas usage and 0.6 kilowatt-hours of electricity per square footage per month for all other facility types.
- 40 pounds (18 kilograms) of non-hazardous waste per employee per month.
4 Data associated with activities not related with production, assembly or distribution are excluded.
5 Data associated with acquisitions is included within values presented starting the year following acquisition.
6 Data associated with the majority of fleet fuel usage has not been included.
7 Data and metrics associated with the manufacturing and field service activities of Stanley Access Technologies is included in 2024 values (excluding the field service activities of Stanley Access Technologies, LTIR and TRIR were 0.12 and 0.44 for 2024). For 2023, only the manufacturing activities of Stanley Access Technologies are included. Baseline year 2020 has not been adjusted.
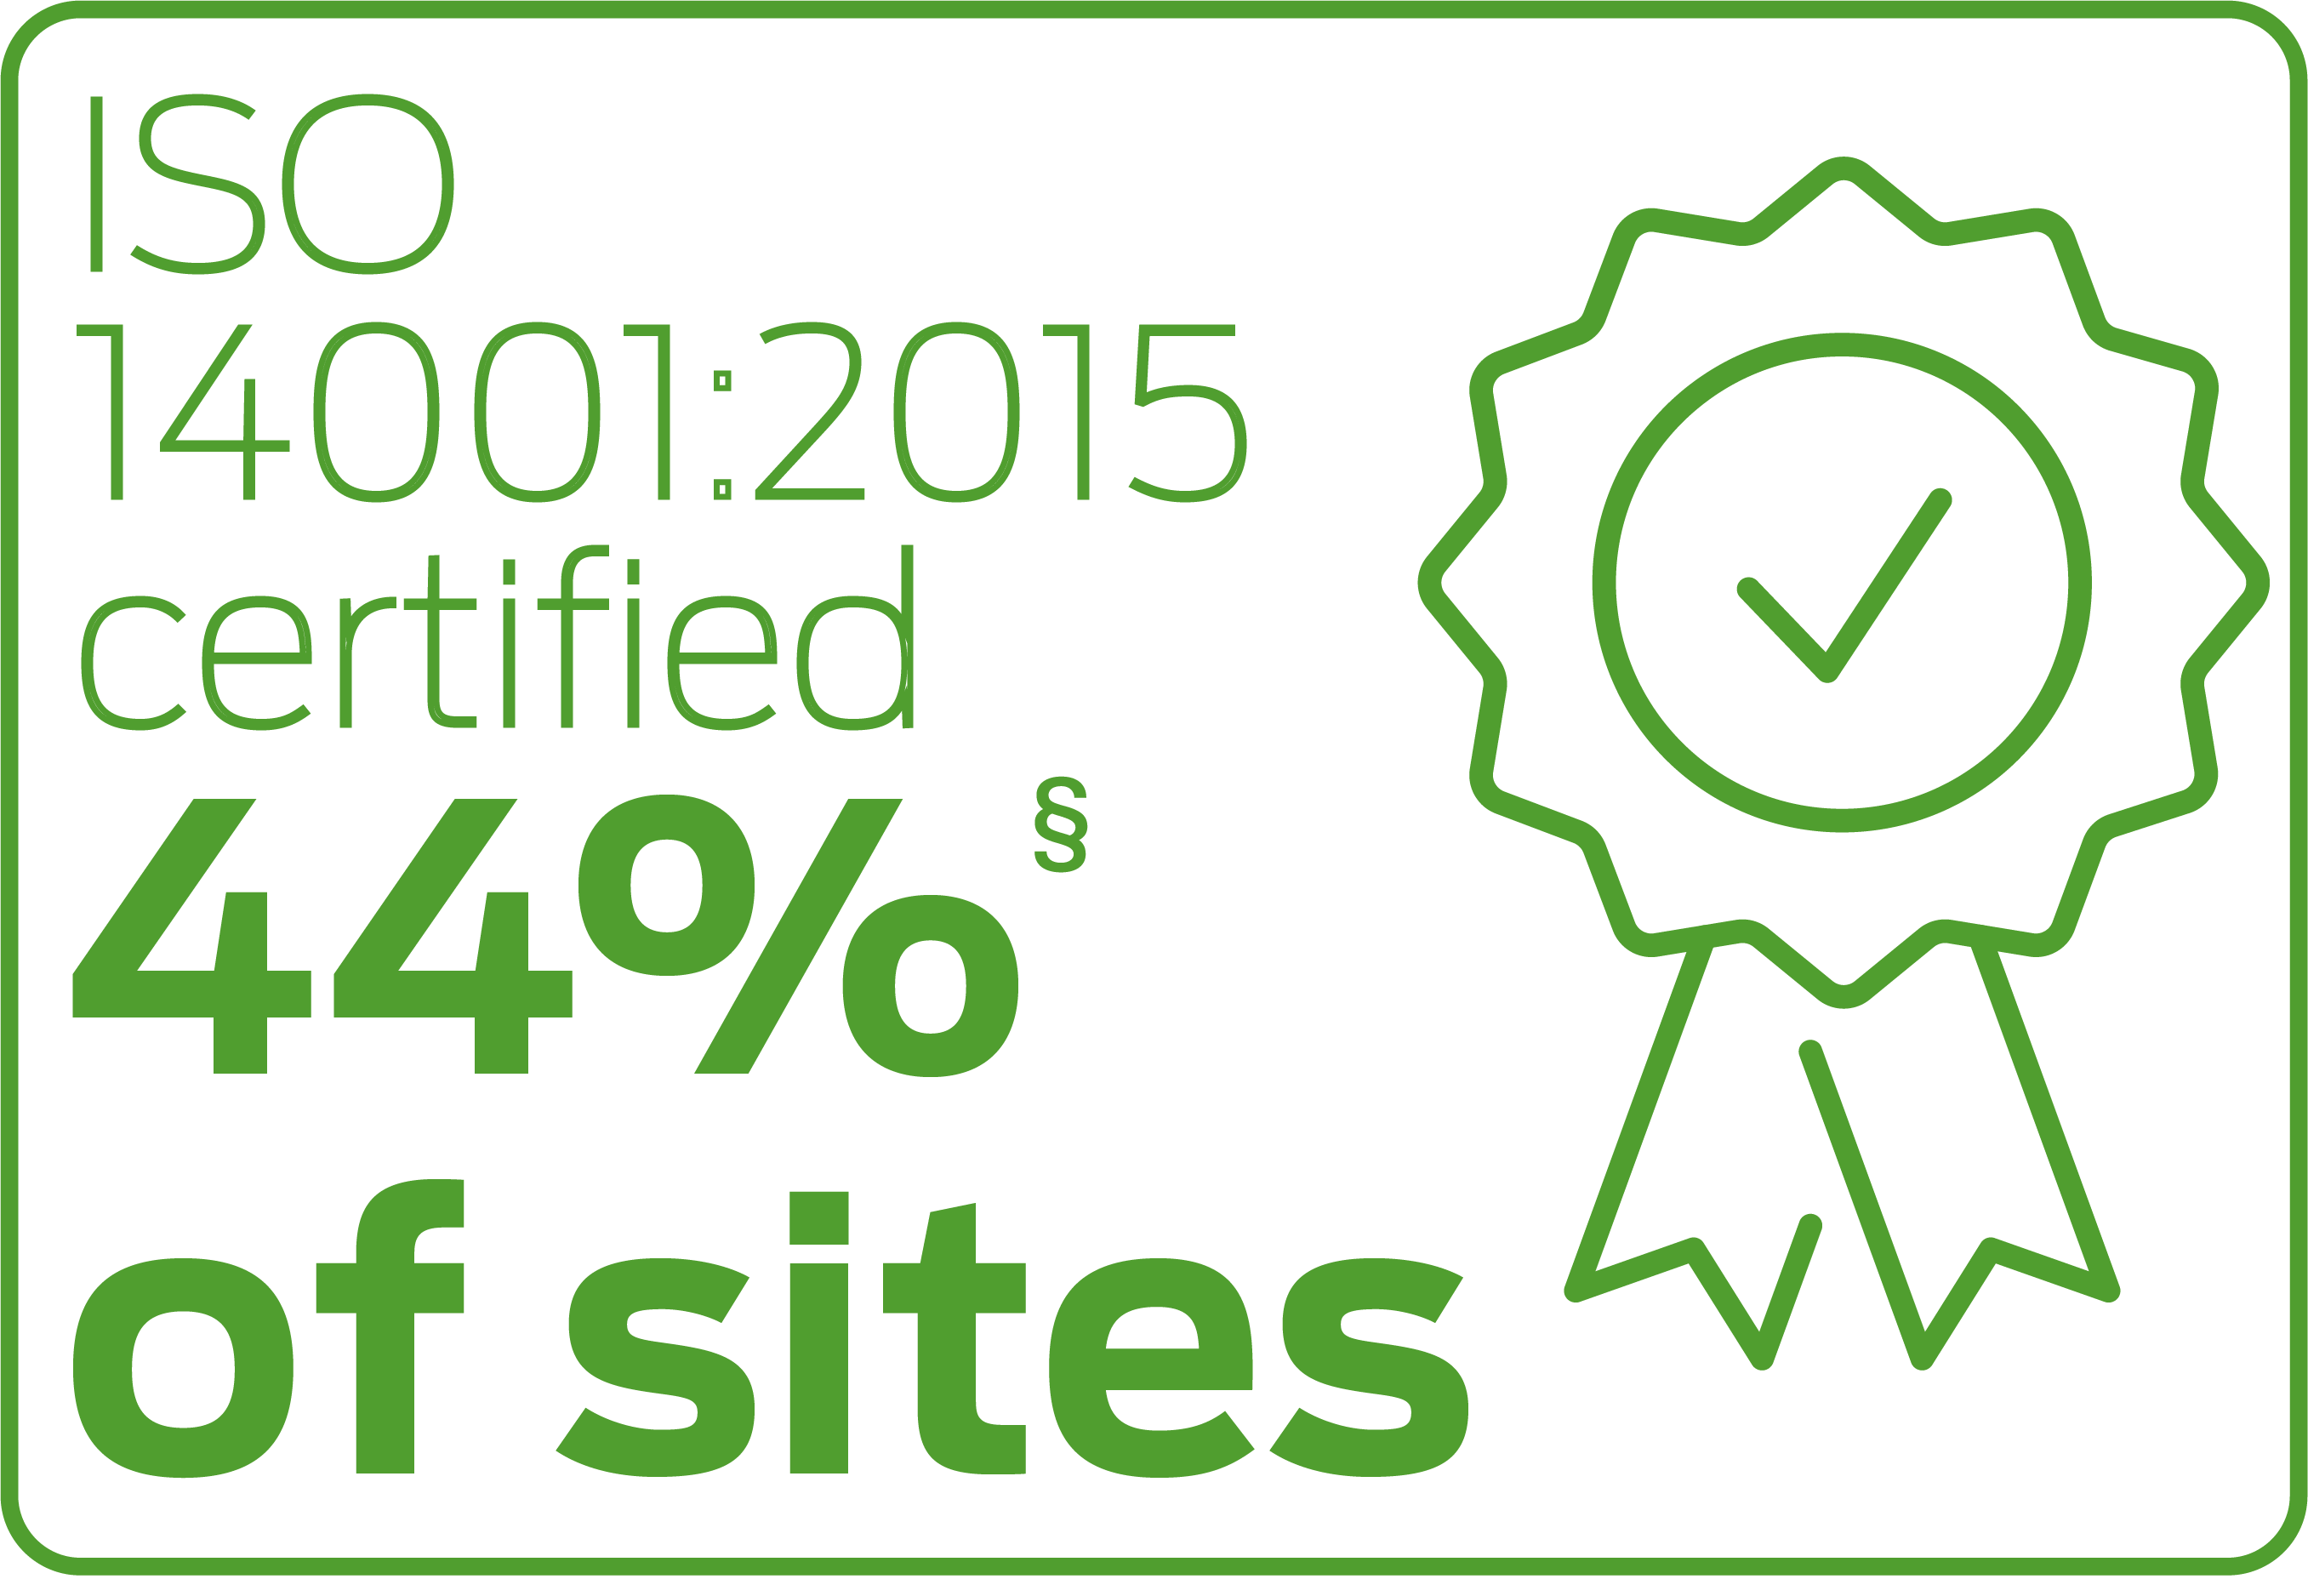
ISO 14001:2015 certified 44% of sites
Allegion recognizes the positive impact that increasing and improving our environmental management systems has on operations. As of Dec. 31, 2024, 44% of our principal production, assembly and distribution sites are ISO 14001:2015 certified §. This means they’re in compliance with an international standard for occupational health and safety issued by the International Organization for Standardization. By 2030, we aim to increase the number of certified sites to 50%, compared to the 2020 baseline year.
§ Based on the sites listed in "Item1: Business" of the company's Form 10-K for the related year.

Named 2024 winner of 2 Seal awards
Allegion has been honored with two 2024 SEAL Business Sustainability Awards for environmental initiatives. SEAL, which stands for sustainability, environmental achievement and leadership, is an environmental advocacy organization that honors leadership through its business sustainability awards and environmental journalism awards.
We were recognized for two impactful projects that reduce our environmental footprint: a logistics reconfiguration that optimizes cargo shipments to our U.S. distribution center in Kansas and a glass recycling initiative at our Technical Glass Products (TGP) facility in Washington, which manufactures fire-rated glass for commercial applications.
The logistics project improved container utilization by 35-55%, cutting scope 3 carbon emissions by approximately 486 metric tons annually. Meanwhile, TGP recycled over 35,000 pounds of fire-rated scrap glass in 2024 and is estimated to divert 280,000 pounds of glass waste from the landfill annually.
Waste reduction project wins award
In August 2024, Allegion won a Sustainability Initiative of the Year award from the Business Intelligence Group for our Sustainability Kaizen project, which aims to reduce waste in our U.S. manufacturing facilities. Through the Sustainability Awards program, the Business Intelligence Group honors organizations, products, people and initiatives that prioritize sustainability in business practices.
A Kaizen is a Japanese philosophy that involves including all employees to improve a manufacturing process. Over an 18-month period, Allegion’s Environmental, Health and Safety (EHS) team developed and implemented a process to help facilities assess and reduce their environmental impact. This initiative aligns with Allegion’s environmental goals, which include a 20% reduction in waste-to-landfill by 2030, with a new waste diversion metric added in 2023. Allegion focuses on recycling and reusing materials, using waste-to-energy solutions only as a last resort.
Wildlife council certifies pollinator habitat
A pollinator garden built in the outdoor area of our Von Duprin manufacturing facility in Indianapolis, Indiana, during a 2021 renovation has achieved the Wildlife Habitat Council’s Conservation Certification for the second time. The Wildlife Habitat Council (WHC) is an organization that promotes and certifies habitat conservation and management on corporate lands through partnerships and education, focusing on healthy ecosystems and connected communities. WHC-assisted wildlife habitats and education programs are in 24 countries and 48 U.S. states.
In 2021, as part of a parking lot renovation at the facility, the Environmental, Health and Safety (EHS) team collaborated with the Facilities and Maintenance teams to create a landscape design featuring natural green spaces with pollinator-friendly native plants. This transformed the once heavily cemented area into a haven for native species, playing a crucial role in maintaining essential ecological processes. Employees continue to document pollinators like honeybees, butterflies and various beetle species, which helps maintain the certification.
Products Cradle to Cradle Certified Bronze
Our company is one of the first door hardware manufacturers in the world to become Version 4.0 Cradle to Cradle Certified® Bronze, thanks to the line of AXA’s Home Security aluminum door fittings and pull handles that are on their way to being fully circular — an approach where materials are treated as nutrients that circulate within safe, healthy systems. AXA is one of Allegion’s European brands.
In this circular model, products and systems are crafted with the goal of achieving an infinite life cycle, where materials are reused or recycled without any loss in quality, seamlessly re-entering the production chain. This approach helps ensure sustainability by prioritizing resource efficiency and minimizing environmental impact.
The U.S. and Netherlands-based Cradle to Cradle Products Innovation Institute developed a global standard that’s used by future-focused designers, brands, retailers and manufacturers to make safe, circular and equitable materials and products. Bronze is the first level of certification — a foundation for advancement to silver, gold and platinum levels — evaluating products in five categories: material health, materials reuse, renewable energy and carbon management, water management and social justice. Read more about our certification.
1 GHG emissions calculations previously used a set formula globally. Calculations have been revised for 2020 through 2024 to utilize available location specific grid data.
2 Data is normalized to hours worked. To the extent actual hours worked are not available for any full-time employee, an average of 40 hours per week is used.
3 Actual data is collected for production, assembly and distribution facilities and certain warehouses globally. For all other facilities, data is estimated based on the assumptions below:
- 15 gallons (or 57 liters) of water used per employee per workday.
- 2,700 British Thermal Units of natural gas usage and 1.5 kilowatt hours of electricity usage per square footage per month for office type facilities.
- 2,000 British Thermal Units of natural gas usage and 0.6 kilowatt-hours of electricity per square footage per month for all other facility types.
- 40 pounds (18 kilograms) of non-hazardous waste per employee per month.
4 Data associated with activities not related with production, assembly or distribution are excluded.
5 Data associated with acquisitions is included within values presented starting the year following acquisition.
6 Data associated with the majority of fleet fuel usage has not been included.
7 Data and metrics associated with the manufacturing and field service activities of Stanley Access Technologies is included in 2024 values (excluding the field service activities of Stanley Access Technologies, LTIR and TRIR were 0.12 and 0.44 for 2024). For 2023, only the manufacturing activities of Stanley Access Technologies are included. Baseline year 2020 has not been adjusted.
§ Based on the sites listed in "Item1: Business" of the company's Form 10-K for the related year.
CDP reports
The CDP is a not-for-profit organization that runs the global disclosure system for investors, companies, cities, states and regions to manage their environmental impacts. Visit the CDP website to view our climate change and water reports.
Conflict minerals
Learn more about Allegion's efforts to responsibly source materials on our Conflict Minerals page. There, you can also access and download our Conflict Minerals Report.
EHS policy
Allegion is proactive in environmental, health and safety (EHS) management, promoting workplace safety, managing energy and resource consumption, and reducing environmental waste.
Materials traceability
Allegion's goal is to design products with awareness of environmental impact and collaborate with our supply chain to source responsibly. We expect all our suppliers to meet or exceed these same regulations and standards.
Sustainable building
Allegion supports architects and building owners in creating environmentally safe and sustainable structures. See more on LEED, the Living Building Challenge and other sustainability organizations.


