
Allegion has mobilized a cross-functional ESG Council to support our ongoing commitment to
environmental, social and governance matters.
Allegion strives to create a company where all people feel welcome and valued. We know it's a journey but, together, the people of Allegion are creating a more inclusive workplace and a more equitable, better world. Each section below shows the progress of where we've been and the goals for where we are going.
Environmental
Environmental Impact
Most of our environmental goals target a 2030 completion date, and 2020 is used as the baseline year for comparison purposes (unless otherwise noted).
Goal: Achieve a 25% reduction in greenhouse gas (GHG) emissions intensity for Scope 1 and Scope 2 emissions.
Target completion date: 2030
Goal achieved: 2023

Goal: Achieve a 40% reduction in greenhouse gas (GHG) emissions intensity for Scope 1 and Scope 2 emissions.
Target completion date: 2030
Goal: Use 100% carbon-free electricity.
Target completion date: 2030
Goal: Achieve 20% reduction in water usage.
Target completion date: 2030
Goal achieved: 2024
Goal: Make interim progress toward our long-term goal by achieving carbon neutrality at 50% of our current sites.
Target completion date: 2035
Goal: Achieve carbon neutral emissions globally (without requiring carbon offsets).
Target completion date: 2050
Goal: Achieve 20% reduction in total waste to landfill.
Target completion date: 2030
Environmental KPIs (Absolute)
| Environmental Metrics | 2020 | 2021 | 2022 | 2023 | 2024 | 2025 |
|---|---|---|---|---|---|---|
| Greenhouse Gas (GHG) Emissions (absolute in metric tons CO2e) 2-5 | ||||||
| GHG emissions (Scope 1+2) - market-based | 74,963 | 73,254 | 65,954 | 60,256 | 57,513 | 54,135 |
| GHG emissions (Scope 1+2) - location-based | 74,963 | 74,266 | 71,474 | 72,125 | 70,883 | 70,186 |
| GHG emissions (Scope 1) - direct | 24,451 | 25,623 | 25,624 | 26,000 | 25,095 | 24,914 |
| GHG emissions (Scope 2) - indirect, market-based | 50,512 | 47,631 | 40,330 | 34,256 | 32,418 | 29,221 |
| GHG emissions (Scope 2) - indirect, location-based | 50,512 | 48,643 | 45,850 | 46,125 | 45,788 | 45,272 |
| Energy Consumption (absolute in MWh) 2-5 | ||||||
| Total energy consumption within the organization | 246,712 | 255,474 | 250,603 | 249,077 | 247,746 | 247,202 |
| Electricity total | 114,213 | 116,002 | 110,548 | 107,441 | 110,859 | 112,987 |
| Fuel total | 132,499 | 139,472 | 140,055 | 141,636 | 136,887 | 134,215 |
| Waste Management (absolute in metric tons) 2-4 | ||||||
| Total waste generated within the organization | 21,174 | 21,643 | 20,922 | 20,870 | 29,840 | 32,168 |
| Non-hazardous waste | 20,551 | 21,031 | 20,239 | 20,262 | 29,163 | 31,414 |
| Hazardous waste | 623 | 611 | 683 | 607 | 677 | 754 |
| Total non-landfill waste | 19,168 | 19,610 | 18,279 | 18,272 | 27,828 | 30,380 |
| Non-hazardous waste | 18,678 | 19,130 | 17,718 | 17,774 | 27,263 | 29,763 |
| Hazardous waste | 490 | 480 | 561 | 497 | 565 | 617 |
| Total landfill waste | 2,006 | 2,032 | 2,643 | 2,598 | 2,012 | 1,788 |
| Non-hazardous waste | 1,873 | 1,901 | 2,521 | 2,488 | 1,900 | 1,651 |
| Hazardous waste | 133 | 131 | 123 | 110 | 112 | 137 |
| Waste non-landfill rate (percentage) | 91% | 88% | 88% | 88% | 93% | 94% |
| Water Management (absolute in m3) 2-4 | ||||||
| Total water usage within the organization | 395,128 | 374,542 | 364,612 | 343,855 | 374,833 | 365,998 |
1 Data is normalized to hours worked. To the extent actual hours worked are not available for any full-time employee, an average of 40 hours per week is used.
2 Actual data is collected for most production, assembly, distribution and warehouse facilities globally. For all other facilities, data is estimated based on the assumptions below:
• 15 gallons (or 57 liters) of water used per employee per workday.
• 2,700 British Thermal Units of natural gas usage and 1.5 kilowatt hours of electricity usage per square footage per month for office type facilities.
• 2,000 British Thermal Units of natural gas usage and 0.6 kilowatt hours of electricity per square footage per month for all other facility types.
• 40 pounds (18 kilograms) of non-hazardous waste per employee per month.
3 Data associated with non-routine activities not related with production, assembly or distribution are excluded.
4 Data associated with acquisitions made in 2024 and 2025 is excluded.
5 Data associated with fleet fuel usage has not been included.
Environmental KPIs (Intensity)
| Environmental Metrics | 2020 | 2021 | 2022 | 2023 | 2024 | 2025 |
|---|---|---|---|---|---|---|
| Intensity metrics (normalized based on revenue (millions)) 2-5 | ||||||
| GHG emissions (Scope 1+2) - market-based | 27.56 | 25.55 | 20.63 | 17.26 | 15.25 | 13.31 |
| GHG emissions (Scope 1+2) - location-based | 27.56 | 25.90 | 22.36 | 20.65 | 18.79 | 17.26 |
| GHG emissions (Scope 1) - direct | 8.99 | 8.94 | 8.01 | 7.45 | 6.65 | 6.13 |
| GHG emissions (Scope 2) - indirect, market-based | 18.57 | 16.61 | 12.62 | 9.81 | 8.60 | 7.18 |
| GHG emissions (Scope 2) - indirect, location-based | 18.57 | 16.96 | 14.35 | 13.20 | 12.14 | 11.13 |
| Energy intensity | 90.71 | 89.11 | 78.39 | 71.33 | 65.68 | 60.78 |
| Waste intensity | 7.78 | 7.55 | 6.54 | 5.98 | 7.91 | 7.91 |
| Water intensity | 145.27 | 130.64 | 114.05 | 98.47 | 99.37 | 89.99 |
| Revenue (millions) | $2,720 | $2,867 | $3,197 | $3,492 | $3,772 | $4,067 |
| Intensity metrics (normalized based on hours worked (thousands)) 1-5 | ||||||
| GHG emissions (Scope 1+2) - market-based | 3.21 | 3.18 | 2.71 | 2.48 | 2.12 | 1.99 |
| GHG emissions (Scope 1+2) - location-based | 3.21 | 3.23 | 2.94 | 2.97 | 2.62 | 2.59 |
| GHG emissions (Scope 1) - direct | 1.05 | 1.11 | 1.05 | 1.07 | 0.93 | 0.92 |
| GHG emissions (Scope 2) - indirect, market-based | 2.16 | 2.07 | 1.66 | 1.41 | 1.19 | 1.07 |
| GHG emissions (Scope 2) - indirect, location-based | 2.16 | 2.12 | 1.89 | 1.90 | 1.69 | 1.67 |
| Energy intensity | 10.58 | 11.10 | 10.29 | 10.26 | 9.15 | 9.11 |
| Waste intensity | 0.91 | 0.94 | 0.86 | 0.86 | 1.10 | 1.18 |
| Water intensity | 16.94 | 16.27 | 14.97 | 14.16 | 13.84 | 13.48 |
| Hours worked (thousands) | 23,330 | 23,021 | 24,349 | 24,285 | 27,086 | 27,147 |
1 Data is normalized to hours worked. To the extent actual hours worked are not available for any full-time employee, an average of 40 hours per week is used.
2 Actual data is collected for most production, assembly, distribution and warehouse facilities globally. For all other facilities, data is estimated based on the assumptions below:
• 15 gallons (or 57 liters) of water used per employee per workday.
• 2,700 British Thermal Units of natural gas usage and 1.5 kilowatt hours of electricity usage per square footage per month for office type facilities.
• 2,000 British Thermal Units of natural gas usage and 0.6 kilowatt hours of electricity per square footage per month for all other facility types.
• 40 pounds (18 kilograms) of non-hazardous waste per employee per month.
3 Data associated with non-routine activities not related with production, assembly or distribution are excluded.
4 Data associated with acquisitions made in 2024 and 2025 is excluded.
5 Data associated with fleet fuel usage has not been included.
Environmental Management System Certifications
Goal: Increase the number of sites with ISO 14001:2015 (environmental management system) certification by 50% compared to baseline year 2020, focusing on principal production, assembly and distribution sites.
Target completion date: 2030
Goal achieved: 2024
| ISO 14001:2015 (environmental management system) certification | 2020 | 2021 | 2022 | 2023 | 2024 | 2025 |
|---|---|---|---|---|---|---|
| # of principal production, assembly & distribution sites | 30 | 29 | 29 | 31 | 34 | 37 |
| # of principal production, assembly & distribution sites certified | 10 | 10 | 10 | 10 | 15 | 18 |
| % of sites certified | 33% | 34% | 34% | 32% | 44% | 49% |
| % increase in number of sites certified vs baseline | n/a | --% | --% | --% | 50% | 80% |
Social
Employee Safety
| Safety incidents 1,4 | 2020 | 2021 | 2022 | 2023 | 2024 | 2025 |
|---|---|---|---|---|---|---|
| Total Recordable Incident Rate (TRIR) | 0.39 | 0.38 | 0.40 | 0.40 | 0.63 | 0.78 |
| Lost Time Incident Rate (LTIR) | 0.12 | 0.17 | 0.12 | 0.07 | 0.21 | 0.20 |
| Reported U.S. industry average for incident rates | 3.1 | 3.3 | 3.2 | 3.4 | 3.1 | n/a |
1 Data is normalized to hours worked. To the extent actual hours worked are not available for any full-time employee, an average of 40 hours per week is used.
4 Data associated with acquisitions made in 2024 and 2025 is excluded.
Safety management system certification
Goal: Increase the number of sites with ISO 45001:2018 (safety management system) certification by 50%, focusing on principal production, assembly and distribution sites.
Target completion date: 2030
Goal achieved: 2024
| ISO 45001 (safety management system) certification | 2020 | 2021 | 2022 | 2023 | 2024 | 2025 |
|---|---|---|---|---|---|---|
| # of principal production, assembly & distribution sites | 30 | 29 | 29 | 31 | 34 | 37 |
| # of principal production, assembly & distribution sites certified | 7 | 7 | 7 | 7 | 12 | 12 |
| % of sites certified | 23% | 24% | 24% | 23% | 35% | 32% |
| % increase in number of sites certified vs baseline | n/a | --% | --% | --% | 71% | 71% |
Product quality and safety
Allegion continually works to ensure our products are manufactured in a socially responsible manner and comply with all environmental regulations and health and safety standards for the markets we serve.
That's why we have upgraded our global product safety management process for monitoring and reporting product safety-related recalls (as defined by the U.S. Consumer Product Safety Commission or equivalent international governing body).
Standards and milestones
Completed a comprehensive review of current processes in order to draft a uniform global product safety recall policy.
Allegion's Global Product Safety & Regulatory Recall Policy established, consolidating country-level policies into one uniform approach.
Regulatory monitoring, combined with expertise and internal procedures, help ensure comprehensive programs are in place to manage global compliance requirements, including the EU Registration, Evaluation, Authorization and Restriction of Chemicals (REACH) regulation, Restriction of Certain Hazardous Substances (RoHS) directive and Waste Framework Directive related to Substances of Concern In Products (WFD-SCIP), California Proposition 65, and to address our expectations related to conflict minerals, and anti-slavery and human trafficking.
Supplier management
Allegion is committed to maintaining responsible sourcing standards for supplier selection across all businesses, including to:
- Continually reduce our supplier risk profile through supplier auditing, supplier performance management, supply design development, alternate supplier identification, geographical diversification and monitoring of financial, geopolitical, economic, social, legal, cybersecurity and other risk categories.
- Improve visibility throughout our supply chain tiers to manage risk and supply continuity, globally.
- Educate managed suppliers and spread awareness of our policies on conflict minerals, modern day slavery and anti-human trafficking. Key direct suppliers managed are also assessed for modern slavery risks and conflict mineral risks through risk screens and self-assessments.
We also proactively assess these factors in their standard audit process and work to reduce the risk profile of those suppliers with self-assessments that place them in a high-risk category.
Standards and milestones
Established a Sourcing Council to govern and manage supplier risk, supply continuity and mitigating actions, 2020.
Added the cybersecurity risk metric to the supply risk management process (in addition to the financial, geopolitical, economic, material supply and other risk categories already in place), 2022.
Added privacy impact assessments in the standard work for procurement of services that process personal data of our customers or employees..
Implemented Supplier Risk and Performance Scorecards for key direct suppliers to our U.S. and Asia Pacific sites, 2020. (Supplier scorecards encompass ranging risk categories including modern slavery and conflict mineral risks.)
Supplier diversity
In 2021, Allegion launched its supplier diversity program. We are making progress toward our long-term goal of a best-in-class supply base.
Standards and milestones
Established governance and a Supplier Diversity Council, chartered to make our aspirations operational, 2020.
Launched the Supplier Diversity Program in the U.S., 2021.
Board diversity
Diversity is valued in all aspects of our business. Updates made to the Allegion Board of Directors take into consideration a broad range of factors – including skills, expertise, business and leadership experience, board experience and viewpoints – that would complement the existing Board and contribute to enhancing the quality of its deliberations and decisions, recognizing that our businesses and operations are diverse and global in nature.
| Board of Directors diversity | 2020 | 2021 | 2022 | 2023 | 2024 | 2025 |
|---|---|---|---|---|---|---|
| Total # of directors | 8 | 9 | 9 | 10 | 9 | 8 |
| Directors, across gender, racial and ethnic diversity | 38% | 44% | 44% | 60% | 67% | 75% |
| Directors, women | 13% | 22% | 22% | 40% | 44% | 50% |
| Directors, racial or ethnic diversity | 25% | 22% | 22% | 20% | 22% | 25% |
Allegion promotes advancement and retention of key talent at all levels and is actively working to build the pipeline of available, diverse talent ready for leadership opportunities. To make progress, we have set a goal of achieving 30% global gender diversity and 20% U.S. racial and ethnic diversity by 2030 in people manager roles.
We know that employee engagement has a direct connection to attracting and retaining talent, delivering business results and customer excellence, and we are committed to building a strengths-oriented organization where everyone has the opportunity to do their best. We aspire to be a leader in employee engagement and are striving to reach the top quartile of the overall GrandMean by 2030 (as measured by our global employee census, conducted by Gallup).
| Workforce Diversity | 2020 | 2021 | 2022 | 2023 | 2024 | 2025 |
|---|---|---|---|---|---|---|
| Gender diversity, global (% of total workforce) | ||||||
| Senior leadership team#, women | 27% | 30% | 30% | 22% | 22% | 22% |
| Other leaders#, women | 29% | 29% | 23% | 21% | 25% | 27% |
| People managers#, women | 23% | 24% | 25% | 25% | 25% | 26% |
| Individual contributors, women | 37% | 38% | 35% | 35% | 37% | 37% |
| Global workforce, women | 36% | 36% | 34% | 34% | 35% | 35% |
| Racial and ethnic diversity (% of U.S. workforce) | ||||||
| Senior leadership team, racial and ethnic diversity | 0% | 10% | 0% | 0% | 0% | 0% |
| Other leaders, U.S. | ||||||
| People of color | 7% | 9% | 9% | 10% | 11% | 14% |
| Black/African American | 2% | 2% | 4% | 5% | 2% | 4% |
| Hispanic non-Caucasian/Latinx | 0% | 2% | 4% | 2% | 2% | 2% |
| Asian | 5% | 5% | 0% | 0% | 2% | 4% |
| Other | 0% | 0% | 0% | 2% | 4% | 4% |
| People managers, U.S. | ||||||
| People of color | 13% | 13% | 15% | 19% | 19% | 22% |
| Black/African American | 4% | 4% | 4% | 5% | 5% | 5% |
| Hispanic non-Caucasian/Latinx | 5% | 5% | 5% | 6% | 7% | 6% |
| Asian | 3% | 3% | 4% | 5% | 5% | 5% |
| Other | 1% | 1% | 3% | 3% | 3% | 6% |
| Individual contributors, U.S. | ||||||
| People of color | 35% | 36% | 35% | 37% | 38% | 40% |
| Black/African American | 19% | 18% | 18% | 15% | 14% | 14% |
| Hispanic non-Caucasian/Latinx | 7% | 8% | 9% | 11% | 12% | 12% |
| Asian | 6% | 6% | 6% | 6% | 6% | 7% |
| Other | 3% | 4% | 5% | 5% | 6% | 7% |
| All employees, U.S. | ||||||
| People of color | 31% | 32% | 32% | 35% | 37% | 38% |
| Black/African American | 16% | 16% | 16% | 15% | 15% | 14% |
| Hispanic non-Caucasian/Latinx | 7% | 7% | 9% | 10% | 11% | 11% |
| Asian | 5% | 5% | 5% | 6% | 6% | 6% |
| Other | 3% | 4% | 5% | 5% | 5% | 7% |
# 'Senior leadership team' refers to the members of the company's management, i.e. the Executive Leadership Team (ELT). 'Other leaders' refer to those individuals reporting directly to an ELT member. 'People managers' refer to those individuals who have direct reports that they manage.
In the chart below, the orange line shows Allegion's employee engagement ranking expressed as a percentile when its engagement GrandMean is compared to that of all companies in the Gallup database for a given period. The blue line represents Allegion's engagement GrandMean compared to the subset of companies who are in the manufacturing sector. (In Gallup's percentile ranking, a higher number corresponds to higher engagement compared to others.)
Employee engagement GrandMean percentile
Progress toward 75th percentile ‡
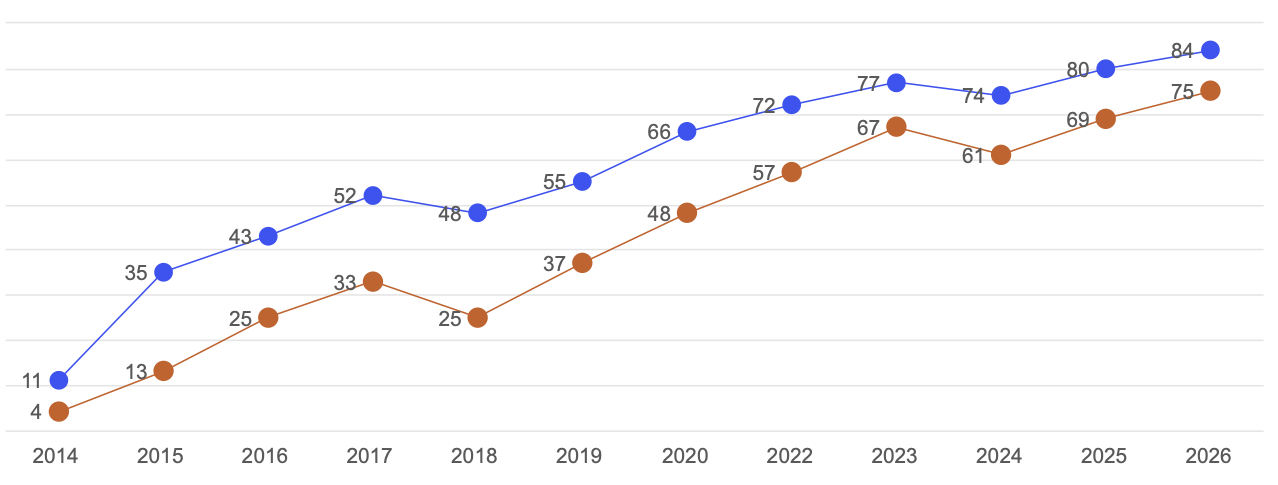
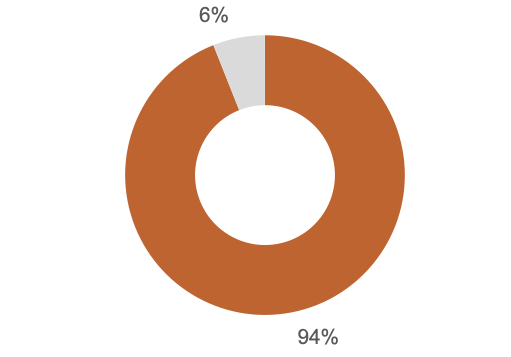
Employee participation rate
Allegion engagement census, 2025
Standards and milestones
Employee mentoring and coaching programs are offered globally.
Annual individual performance reviews for all salaried employees.
Employee feedback is also provided through the employee engagement census.
In 2024, Allegion became one of the first manufacturing companies ever to be honored with the Gallup Exceptional Workplace Award (GEWA), a highly competitive honor that recognizes the world’s most engaged places to work.
In 2026, Allegion received the GEWA for the third consecutive year.
An open feedback culture supports ongoing dialogue on performance and career development.
Governance
Allegion strives to sustain good corporate governance practices that promote the long-term interests of our shareholders, as described in our goals below.
Enterprise risk management
- Maintain Board oversight of our risk management system, including: information technology, cybersecurity, privacy and disruptive technology matters; our ESG system and issues; and the ethics and compliance program.
- Ensure risk management strategies, programs and policies are reviewed at least annually.
Standards and milestones
Allegion's cross-functional ESG Council was established, 2020.
The ESG Materiality Matrix, completed in 2021, is based on input from various stakeholders, including investors, customers, suppliers, architects and builders, and community partners.
The Board has an independent chair, separate from the CEO. In addition, all Board committees and committee chairs are independent.
The Board of Directors refreshment plan is reviewed, annually.
Executive leadership team succession plans are reviewed, annually.
As most recently recorded at the 2026 Annual General Meeting, we have 75% diversity across gender, racial and ethnic representation among the Allegion Board of Directors.
Participation in a number of industry sustainability initiatives to support product design and lifecycle management.
A mature incident and crisis preparedness system is in place, led by the Incident Response Steering Committee.
The Board and its committees have oversight of our risk management system, including: information technology, cybersecurity, privacy and disruptive technology matters; our ESG system and issues; and the ethics and compliance program.
Allegion conducts periodic enterprise risk management surveys to identify the company’s key risks and resiliency. Subject matter experts from Allegion’s executive leadership team are designated to implement risk monitoring and mitigation strategies and actions for each key risk.
Risk management strategies, programs, and policies are reviewed at least annually.
Ethics, compliance, privacy and cybersecurity management
- Annually deliver code of conduct training to salaried employees.
- Regularly deliver sexual harassment training to salaried employees, consistent with local requirements.
- Encourage all employees, contingent workforce, suppliers and other business partners to report violations of our code and provide multiple means for them to do so, including anonymous reporting in multiple languages.
- Maintain a multi-faceted and comprehensive privacy and cybersecurity training program throughout the year, that addresses the needs of all necessary personnel.
- Maintain compliance in the continuously changing environment of global privacy and cybersecurity laws and regulations.
Business ethics, compliance and political influence
Standards and milestones
Our ethics and compliance program extends to all employees, the contingent workforce, and our suppliers and business partners.
We deliver code of conduct training to all salaried employees annually (offered in 9 languages).
We deliver code of conduct training to all new hires.
We deliver harassment and discrimination awareness training to all salaried employees, biennially.
There was a low amount of corporate lobbying expenditures over the past 9 years (2017-2025), less than $150,000 annually.
The Allegion ethics helpline, supported by a third-party, is available 24 hours a day, 7 days a week, and supports 200 languages, providing the option to report violations of our code anonymously.
For the ethics helpline, we aim to resolve all allegations/complaints in an average of 60 days or less.
We do not tolerate retaliation against anyone who asks questions or raises ethical concerns; legal protection is provided for those who report violations (whistleblowers).
No direct corporate political donations have been made over the past 9 years (2017-2025), and we do not have a political action committee.
As seen in the table below, utilization of the ethics helpline has continued to increase in recent years. We have made concerted efforts to drive awareness of the ethics helpline and encourage employees to use this avenue to report violations of our code of conduct. From enacting a whistleblower protection policy and executive videos to ongoing training, posters and an 'Ethics & Compliance Week' campaign, we reinforce the importance of speaking up.
| Ethics & compliance | 2021 | 2022 | 2023 | 2024 | 2025 |
|---|---|---|---|---|---|
| Code of conduct training, completion rate (salaried employees) | 92% | 98% | 99% | 99% | 99% |
| Code of conduct training, new hire completion rate (salaried employees) | 98% | 98% | 99% | 99% | 99% |
| Harassment and discrimination awareness training, completion rate (salaried employees) | offered biennially | 96% | offered biennially | 99% | offered biennially |
| Ethics helpline, # of allegations/complaints | 26 | 41 | 45 | 48 | 65 |
| Ethics helpline, days to resolution of allegations/complaints | n/a | 86 | 54 | 41 | 30 |
Privacy
Standards and milestones
Allegion uses a digital platform to manage our Global Privacy Program to achieve compliance more quickly through automation and enhanced decision-making.
We are using privacy engineering techniques throughout our enterprise systems and our products solutions to drive GDPR and CCPA compliance.
We have integrated privacy-by-design into product development and R&D processes.


