Environmental, social and governance (ESG) factors are a way to measure how a company affects the world around it. At Allegion, our eight values are at the center of our sustainability efforts and the way we run our business.
Learn more about how Allegion has made steady progress in establishing our ESG commitments and sharing our journey.
ESG at a Glance
Download our most recent sustainability update and review how Allegion approaches ESG.
Goals & KPIs
Learn the goals Allegion has set for ourself, and the KPIs we are reaching as we progressing toward them.
Recent progress
Click on our recent milestones below for more information.
Environmental
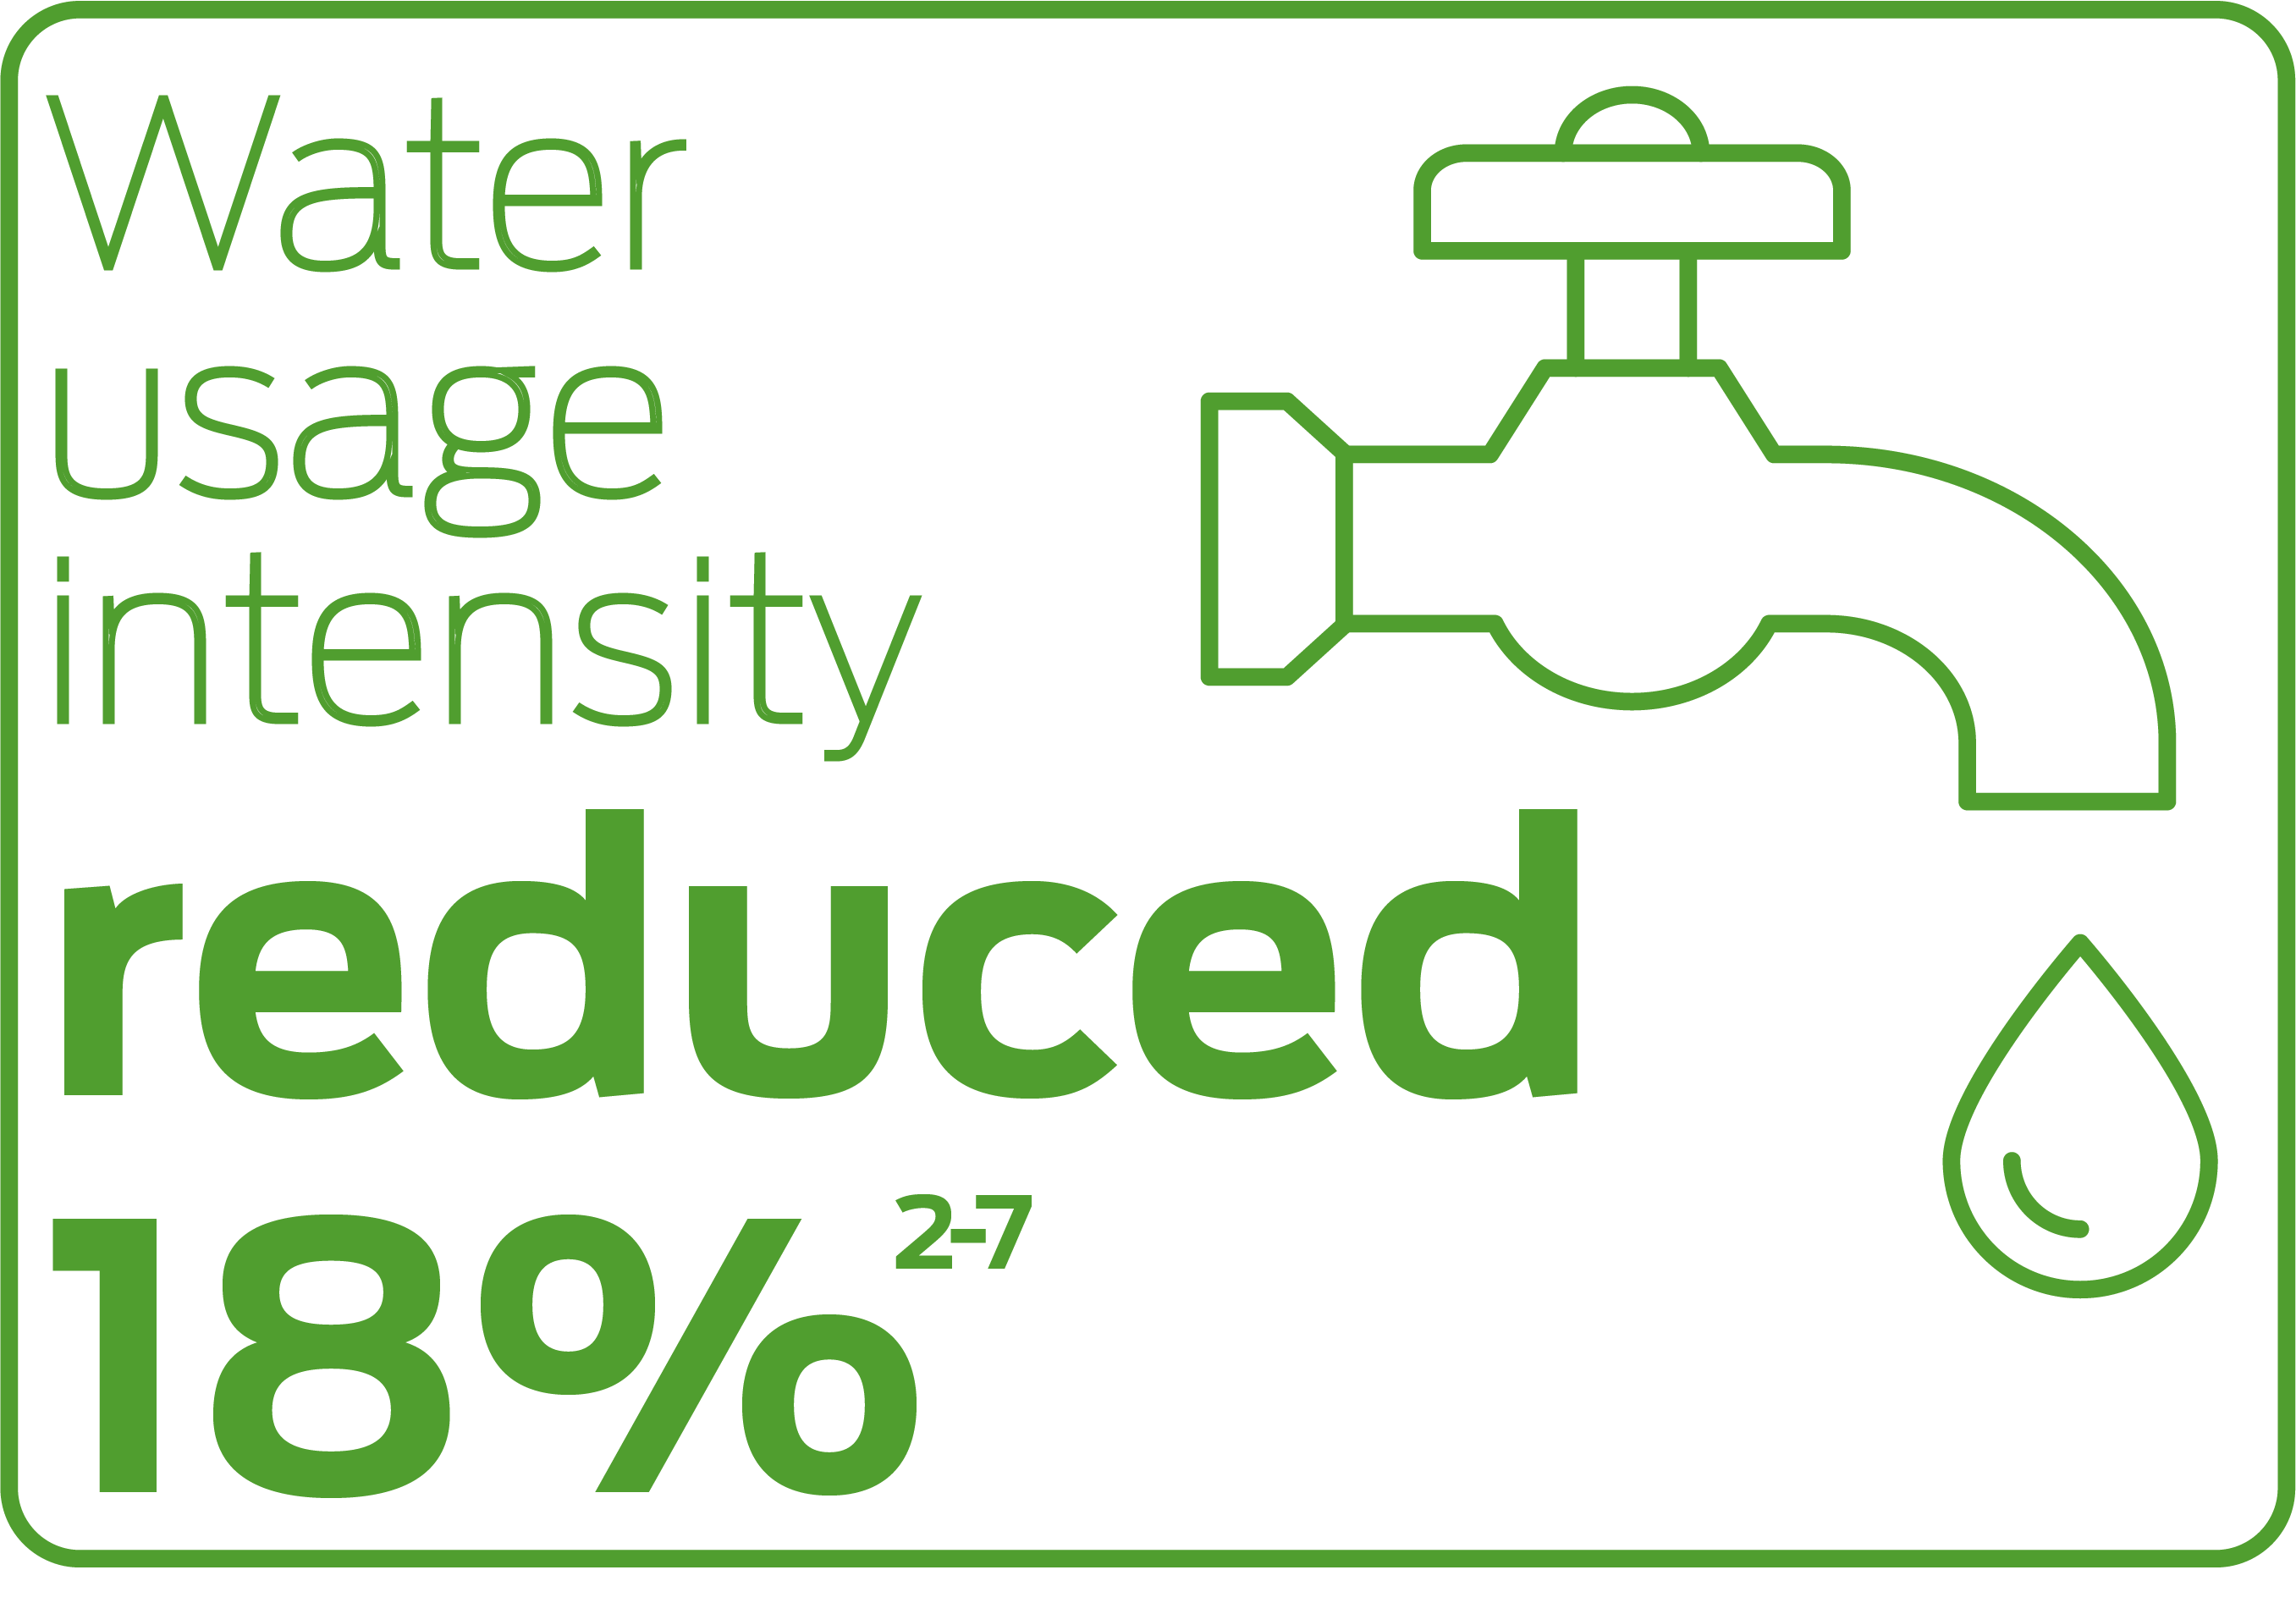
Water usage intensity reduced 18%
As of Dec. 31, 2024, Allegion reduced its water usage intensity by 18% compared to our 2020 baseline year. By 2030, we aim to use 20% less water than we did in 2020.
In our ESG Goals & KPIs section, you’ll find year-over-year data for both normalized data and the actual volume of water used. While volume may vary due to factors such as production output, active hours or the number of sites we operate, normalized data allows us compare "apples-to-apples."
2 Data is normalized to hours worked. To the extent actual hours worked are not available for any full-time employee, an average of 40 hours per week is used.
3 Actual data is collected for production, assembly and distribution facilities and certain warehouses globally. For all other facilities, data is estimated based on the assumptions below:
- 15 gallons (or 57 liters) of water used per employee per workday.
- 2,700 British Thermal Units of natural gas usage and 1.5 kilowatt hours of electricity usage per square footage per month for office type facilities.
- 2,000 British Thermal Units of natural gas usage and 0.6 kilowatt-hours of electricity per square footage per month for all other facility types.
- 40 pounds (18 kilograms) of non-hazardous waste per employee per month.
4 Data associated with activities not related with production, assembly or distribution are excluded.
5 Data associated with acquisitions is included within values presented starting the year following acquisition.
6 Data associated with the majority of fleet fuel usage has not been included.
7 Data and metrics associated with the manufacturing and field service activities of Stanley Access Technologies is included in 2024 values (excluding the field service activities of Stanley Access Technologies, LTIR and TRIR were 0.12 and 0.44 for 2024). For 2023, only the manufacturing activities of Stanley Access Technologies are included. Baseline year 2020 has not been adjusted.
8 LTIR and TRIR reflect workplace related incidents as of 31 December of each year presented. Prior year amounts may be updated when incidents are determined to be workplace related in subsequent periods.
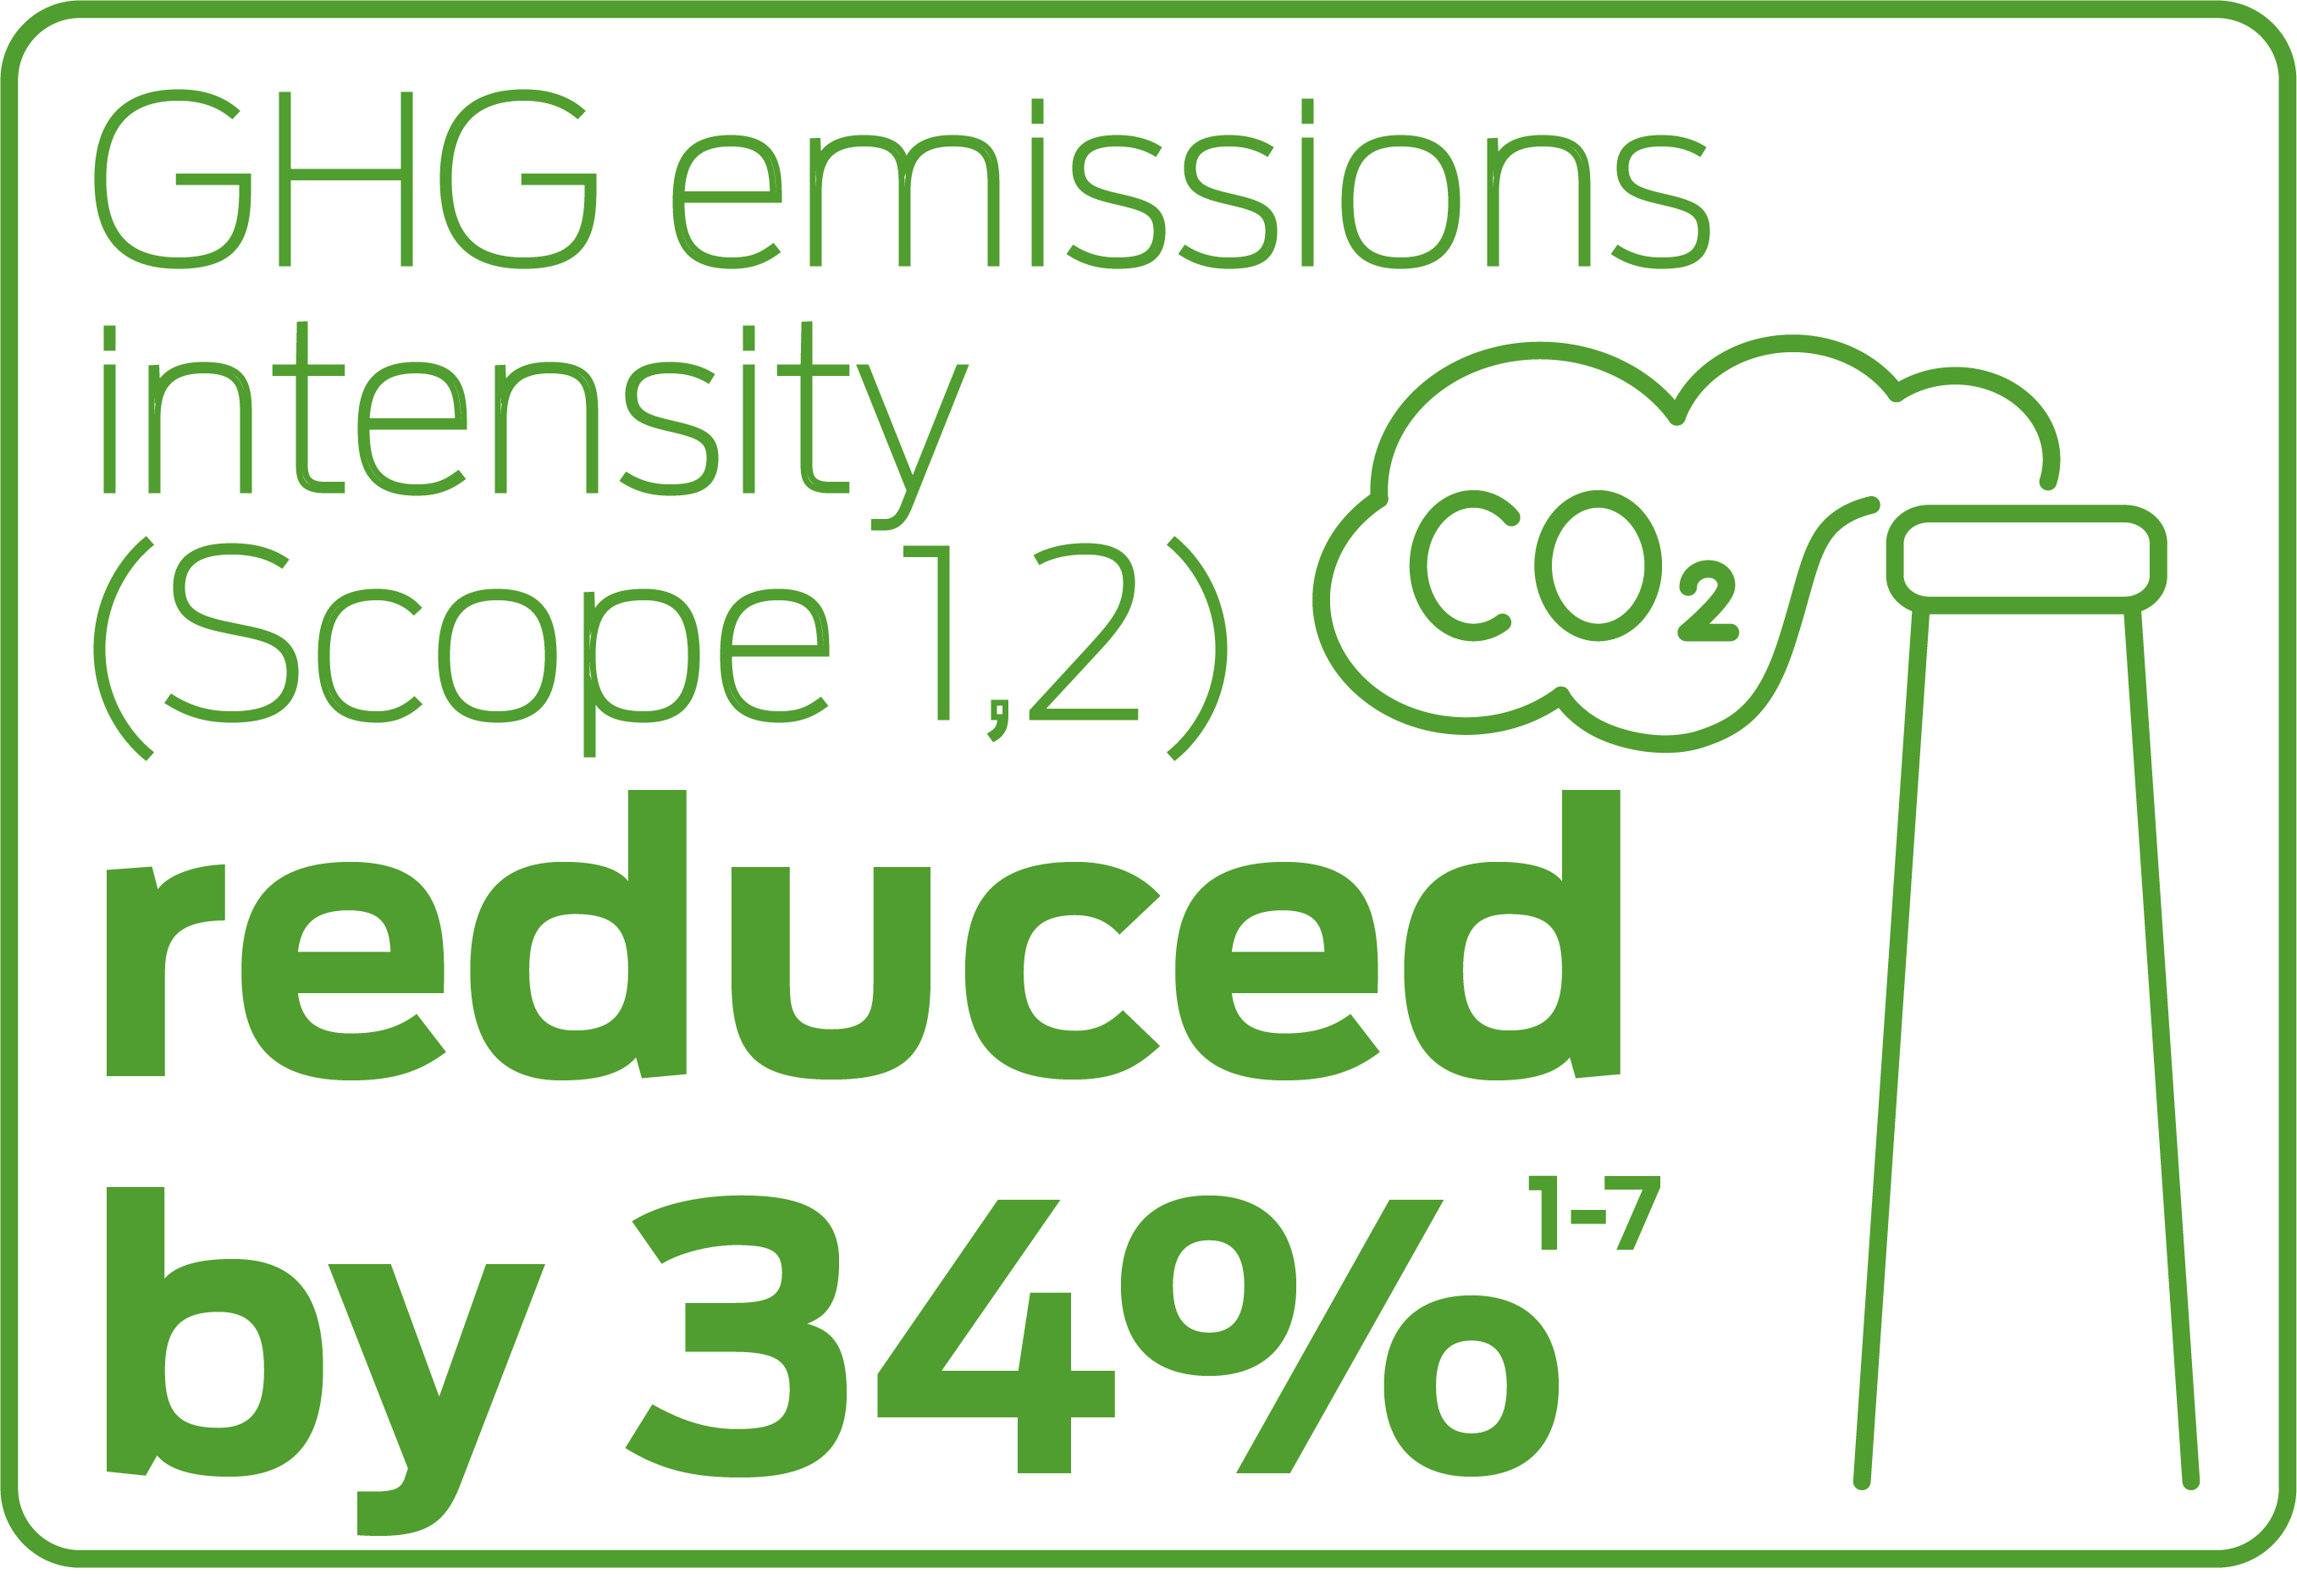
GHG emissions intensity (Scope 1,2) reduced by 34%
As of Dec. 31, 2024, Allegion reduced its greenhouse gas (GHG) emissions intensity (Scope 1 and Scope 2) by 34% compared to our 2020 baseline year. By 2030, we aim to achieve a 40% reduction in GHG emissions intensity for Scope 1 and Scope 2 emissions.
In 2024, Allegion increased its GHG emission intensity (Scope 1 and Scope 2) target from 25% to 40% based on continued improvements in its operations.
Allegion aims to achieve carbon-neutral emissions globally by 2050, and we support the U.N. Sustainable Development Goal to take urgent action on climate change. We know that some communities need time to build necessary energy infrastructure to make this vision a reality. In the meantime, our company is pursuing incremental improvement targets, including meeting Allegion’s electricity needs with 100% carbon-free electricity by 2030 (that is, the energy is produced by a non-fossil fuel source that generates no carbon emissions), and achieving carbon neutrality at 50% of our current sites by 2035.
1 GHG emissions calculations previously used a set formula globally. Calculations have been revised for 2020 through 2024 to utilize available location specific grid data.
2 Data is normalized to hours worked. To the extent actual hours worked are not available for any full-time employee, an average of 40 hours per week is used.
3 Actual data is collected for production, assembly and distribution facilities and certain warehouses globally. For all other facilities, data is estimated based on the assumptions below:
- 15 gallons (or 57 liters) of water used per employee per workday.
- 2,700 British Thermal Units of natural gas usage and 1.5 kilowatt hours of electricity usage per square footage per month for office type facilities.
- 2,000 British Thermal Units of natural gas usage and 0.6 kilowatt-hours of electricity per square footage per month for all other facility types.
- 40 pounds (18 kilograms) of non-hazardous waste per employee per month.
4 Data associated with activities not related with production, assembly or distribution are excluded.
5 Data associated with acquisitions is included within values presented starting the year following acquisition.
6 Data associated with the majority of fleet fuel usage has not been included.
7 Data and metrics associated with the manufacturing and field service activities of Stanley Access Technologies is included in 2024 values (excluding the field service activities of Stanley Access Technologies, LTIR and TRIR were 0.12 and 0.44 for 2024). For 2023, only the manufacturing activities of Stanley Access Technologies are included. Baseline year 2020 has not been adjusted.
8 LTIR and TRIR reflect workplace related incidents as of 31 December of each year presented. Prior year amounts may be updated when incidents are determined to be workplace related in subsequent periods.
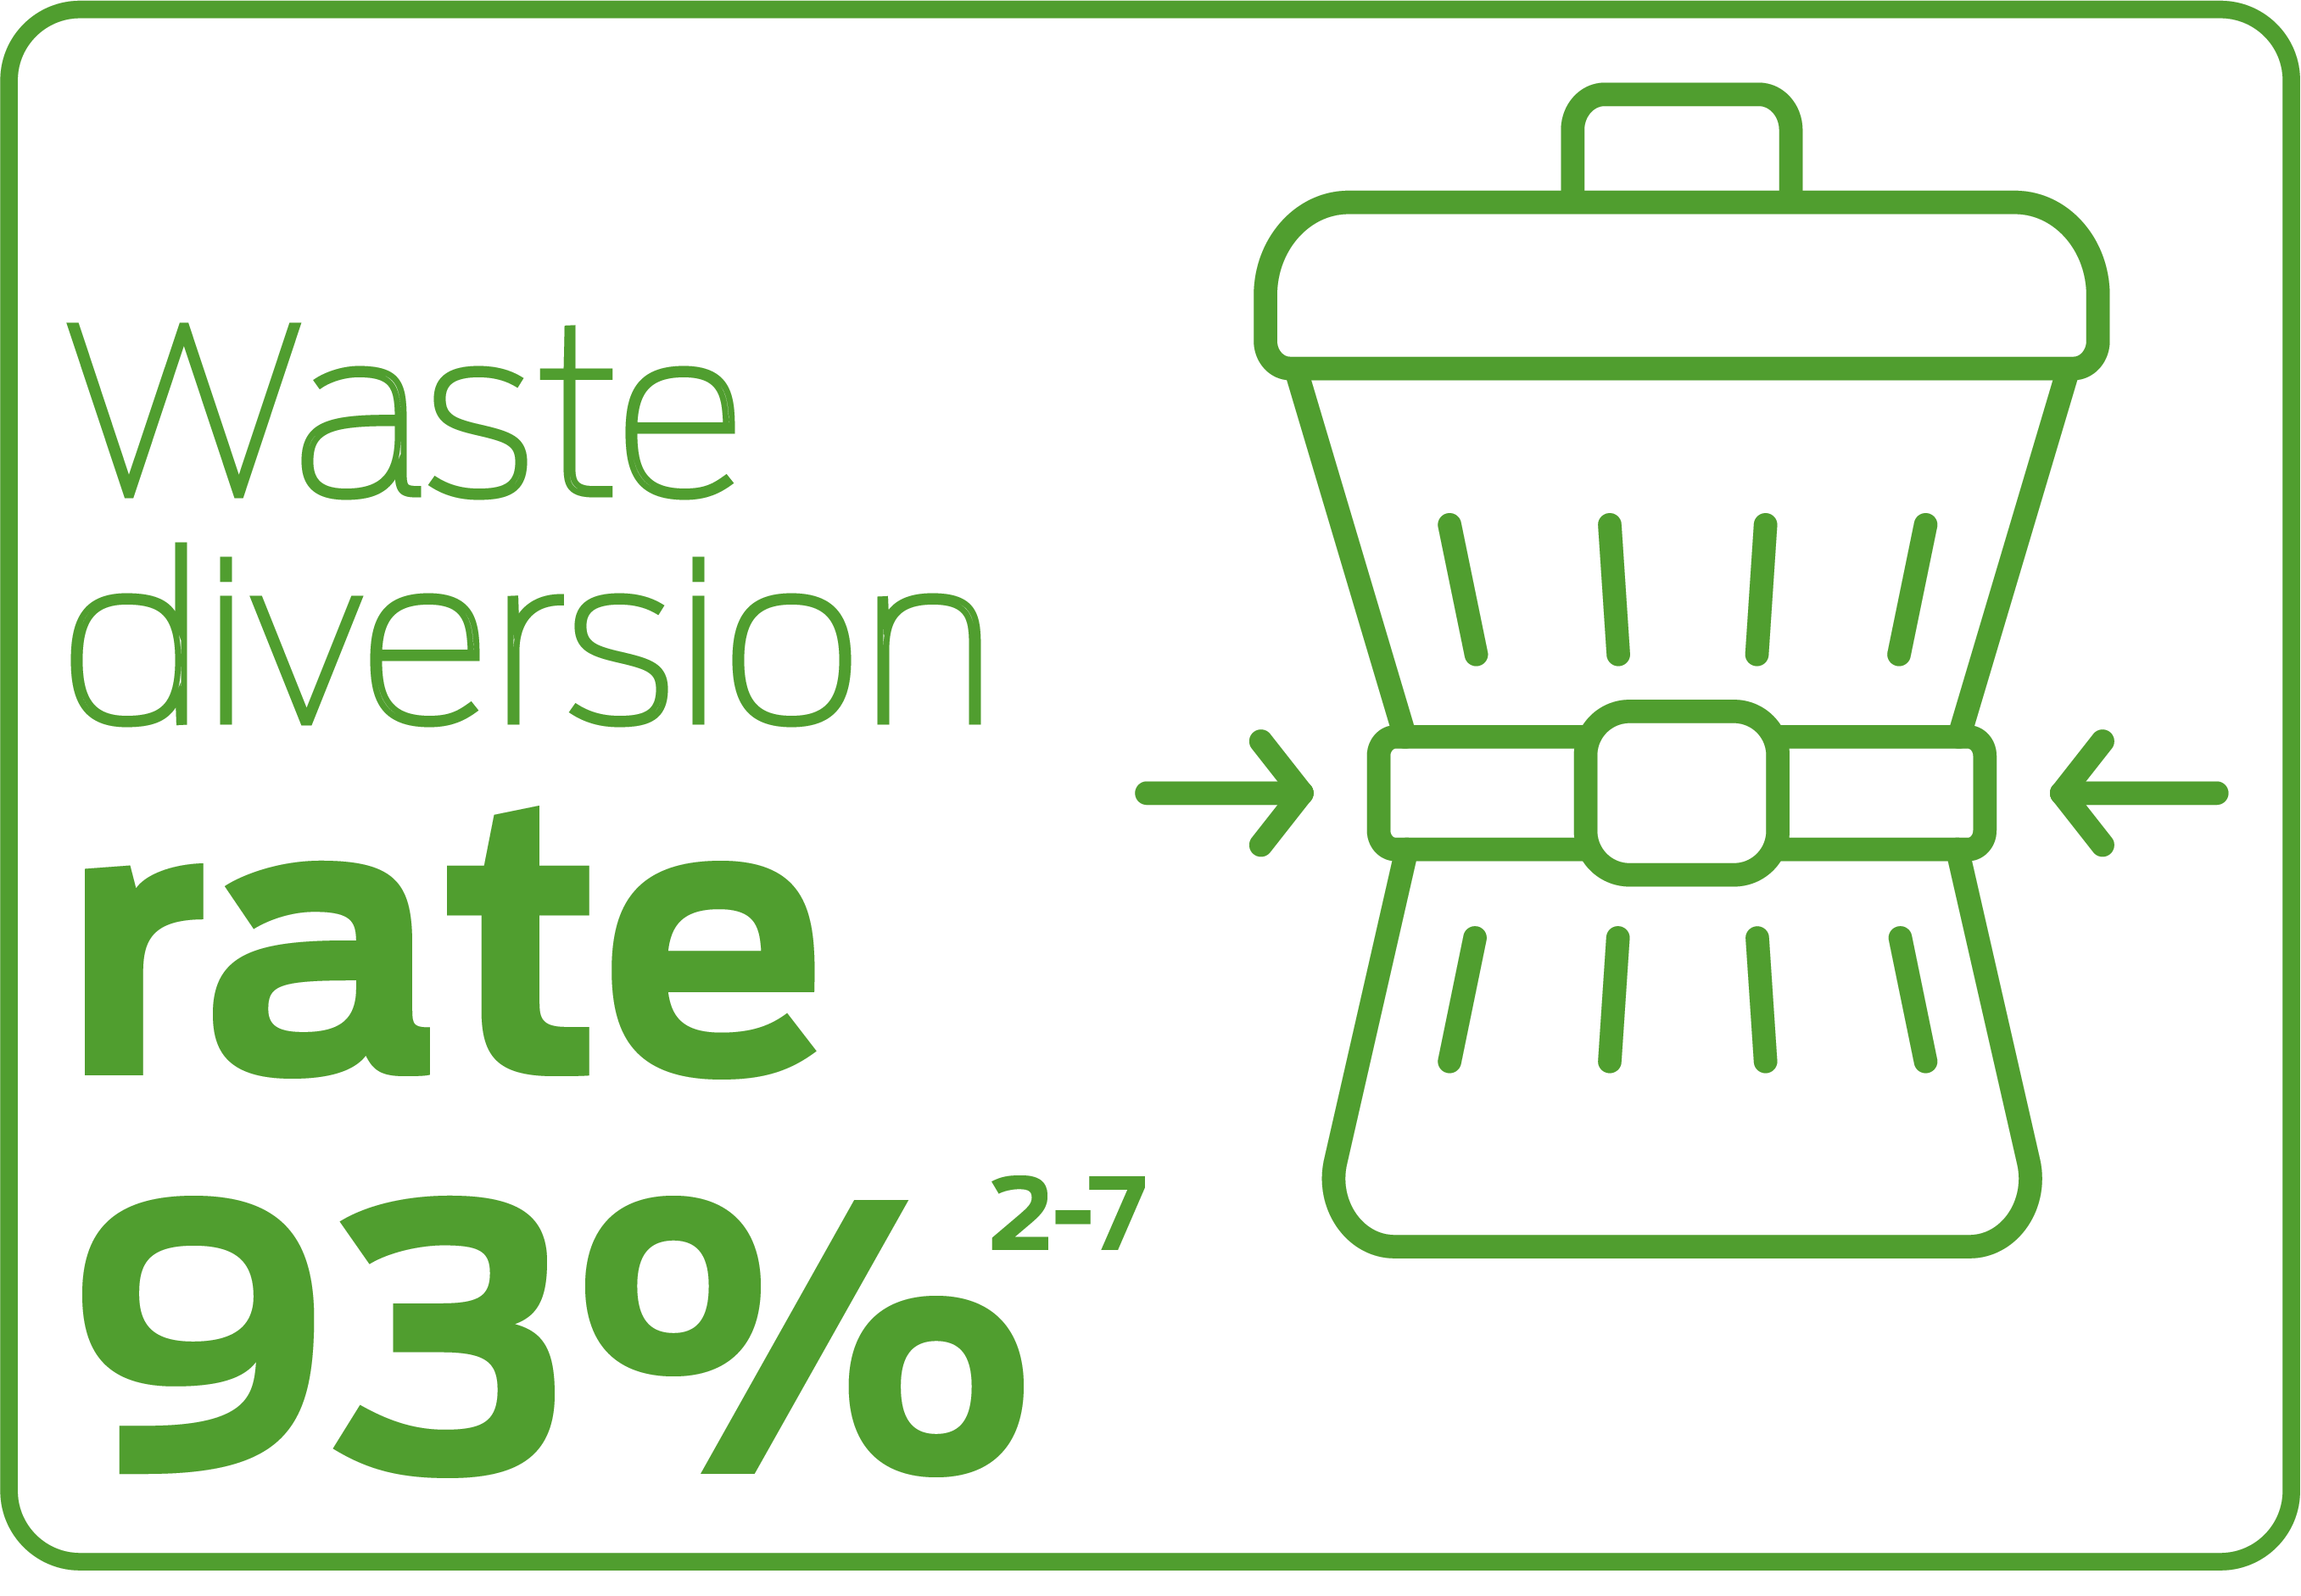
Waste diversion rate 93%
The waste diversion (from landfill) rate is an essential metric for evaluating environmental performance because it reflects an organization's commitment to sustainability and resource conservation. Waste diversion reduces the environmental impact associated with waste disposal, such as greenhouse gas emissions, soil and water pollution and depletion of natural resources.
By measuring waste diversion rate, organizations can track their progress in reducing waste generation and promoting circular economy principles. It encourages the implementation of effective waste management strategies, such as source reduction, recycling programs and alternative treatment initiatives. A high waste diversion rate demonstrates a commitment to responsible practices, serves as a valuable indicator of environmental performance and can enhance an organization's reputation and stakeholder trust.
2 Data is normalized to hours worked. To the extent actual hours worked are not available for any full-time employee, an average of 40 hours per week is used.
3 Actual data is collected for production, assembly and distribution facilities and certain warehouses globally. For all other facilities, data is estimated based on the assumptions below:
- 15 gallons (or 57 liters) of water used per employee per workday.
- 2,700 British Thermal Units of natural gas usage and 1.5 kilowatt hours of electricity usage per square footage per month for office type facilities.
- 2,000 British Thermal Units of natural gas usage and 0.6 kilowatt-hours of electricity per square footage per month for all other facility types.
- 40 pounds (18 kilograms) of non-hazardous waste per employee per month.
4 Data associated with activities not related with production, assembly or distribution are excluded.
5 Data associated with acquisitions is included within values presented starting the year following acquisition.
6 Data associated with the majority of fleet fuel usage has not been included.
7 Data and metrics associated with the manufacturing and field service activities of Stanley Access Technologies is included in 2024 values (excluding the field service activities of Stanley Access Technologies, LTIR and TRIR were 0.12 and 0.44 for 2024). For 2023, only the manufacturing activities of Stanley Access Technologies are included. Baseline year 2020 has not been adjusted.
8 LTIR and TRIR reflect workplace related incidents as of 31 December of each year presented. Prior year amounts may be updated when incidents are determined to be workplace related in subsequent periods.
Social

Won 2025 Gallup award for exceptional workplace
For the second consecutive year, Allegion has been honored with the prestigious 2025 Gallup Exceptional Workplace Award, which recognizes the most engaged workplace cultures in the world — organizations that achieve more by helping their employees focus on what they do best. Employee engagement — a key factor in organizational achievement — reflects an employee’s commitment to the organization. Engaged employees tend to deliver higher productivity, stay with their organizations longer, have lower absenteeism and experience improved well-being.
The highly competitive award underscores the dedication of Allegion’s 12,000+ full-time employees around the globe. Last year, Allegion was among the first manufacturing companies ever to earn this distinction. Living our core values and taking ownership of engagement helps accelerate Allegion’s success and advance our vision of creating a safer and more accessible world.
Lost Time Incident Rate of 0.21
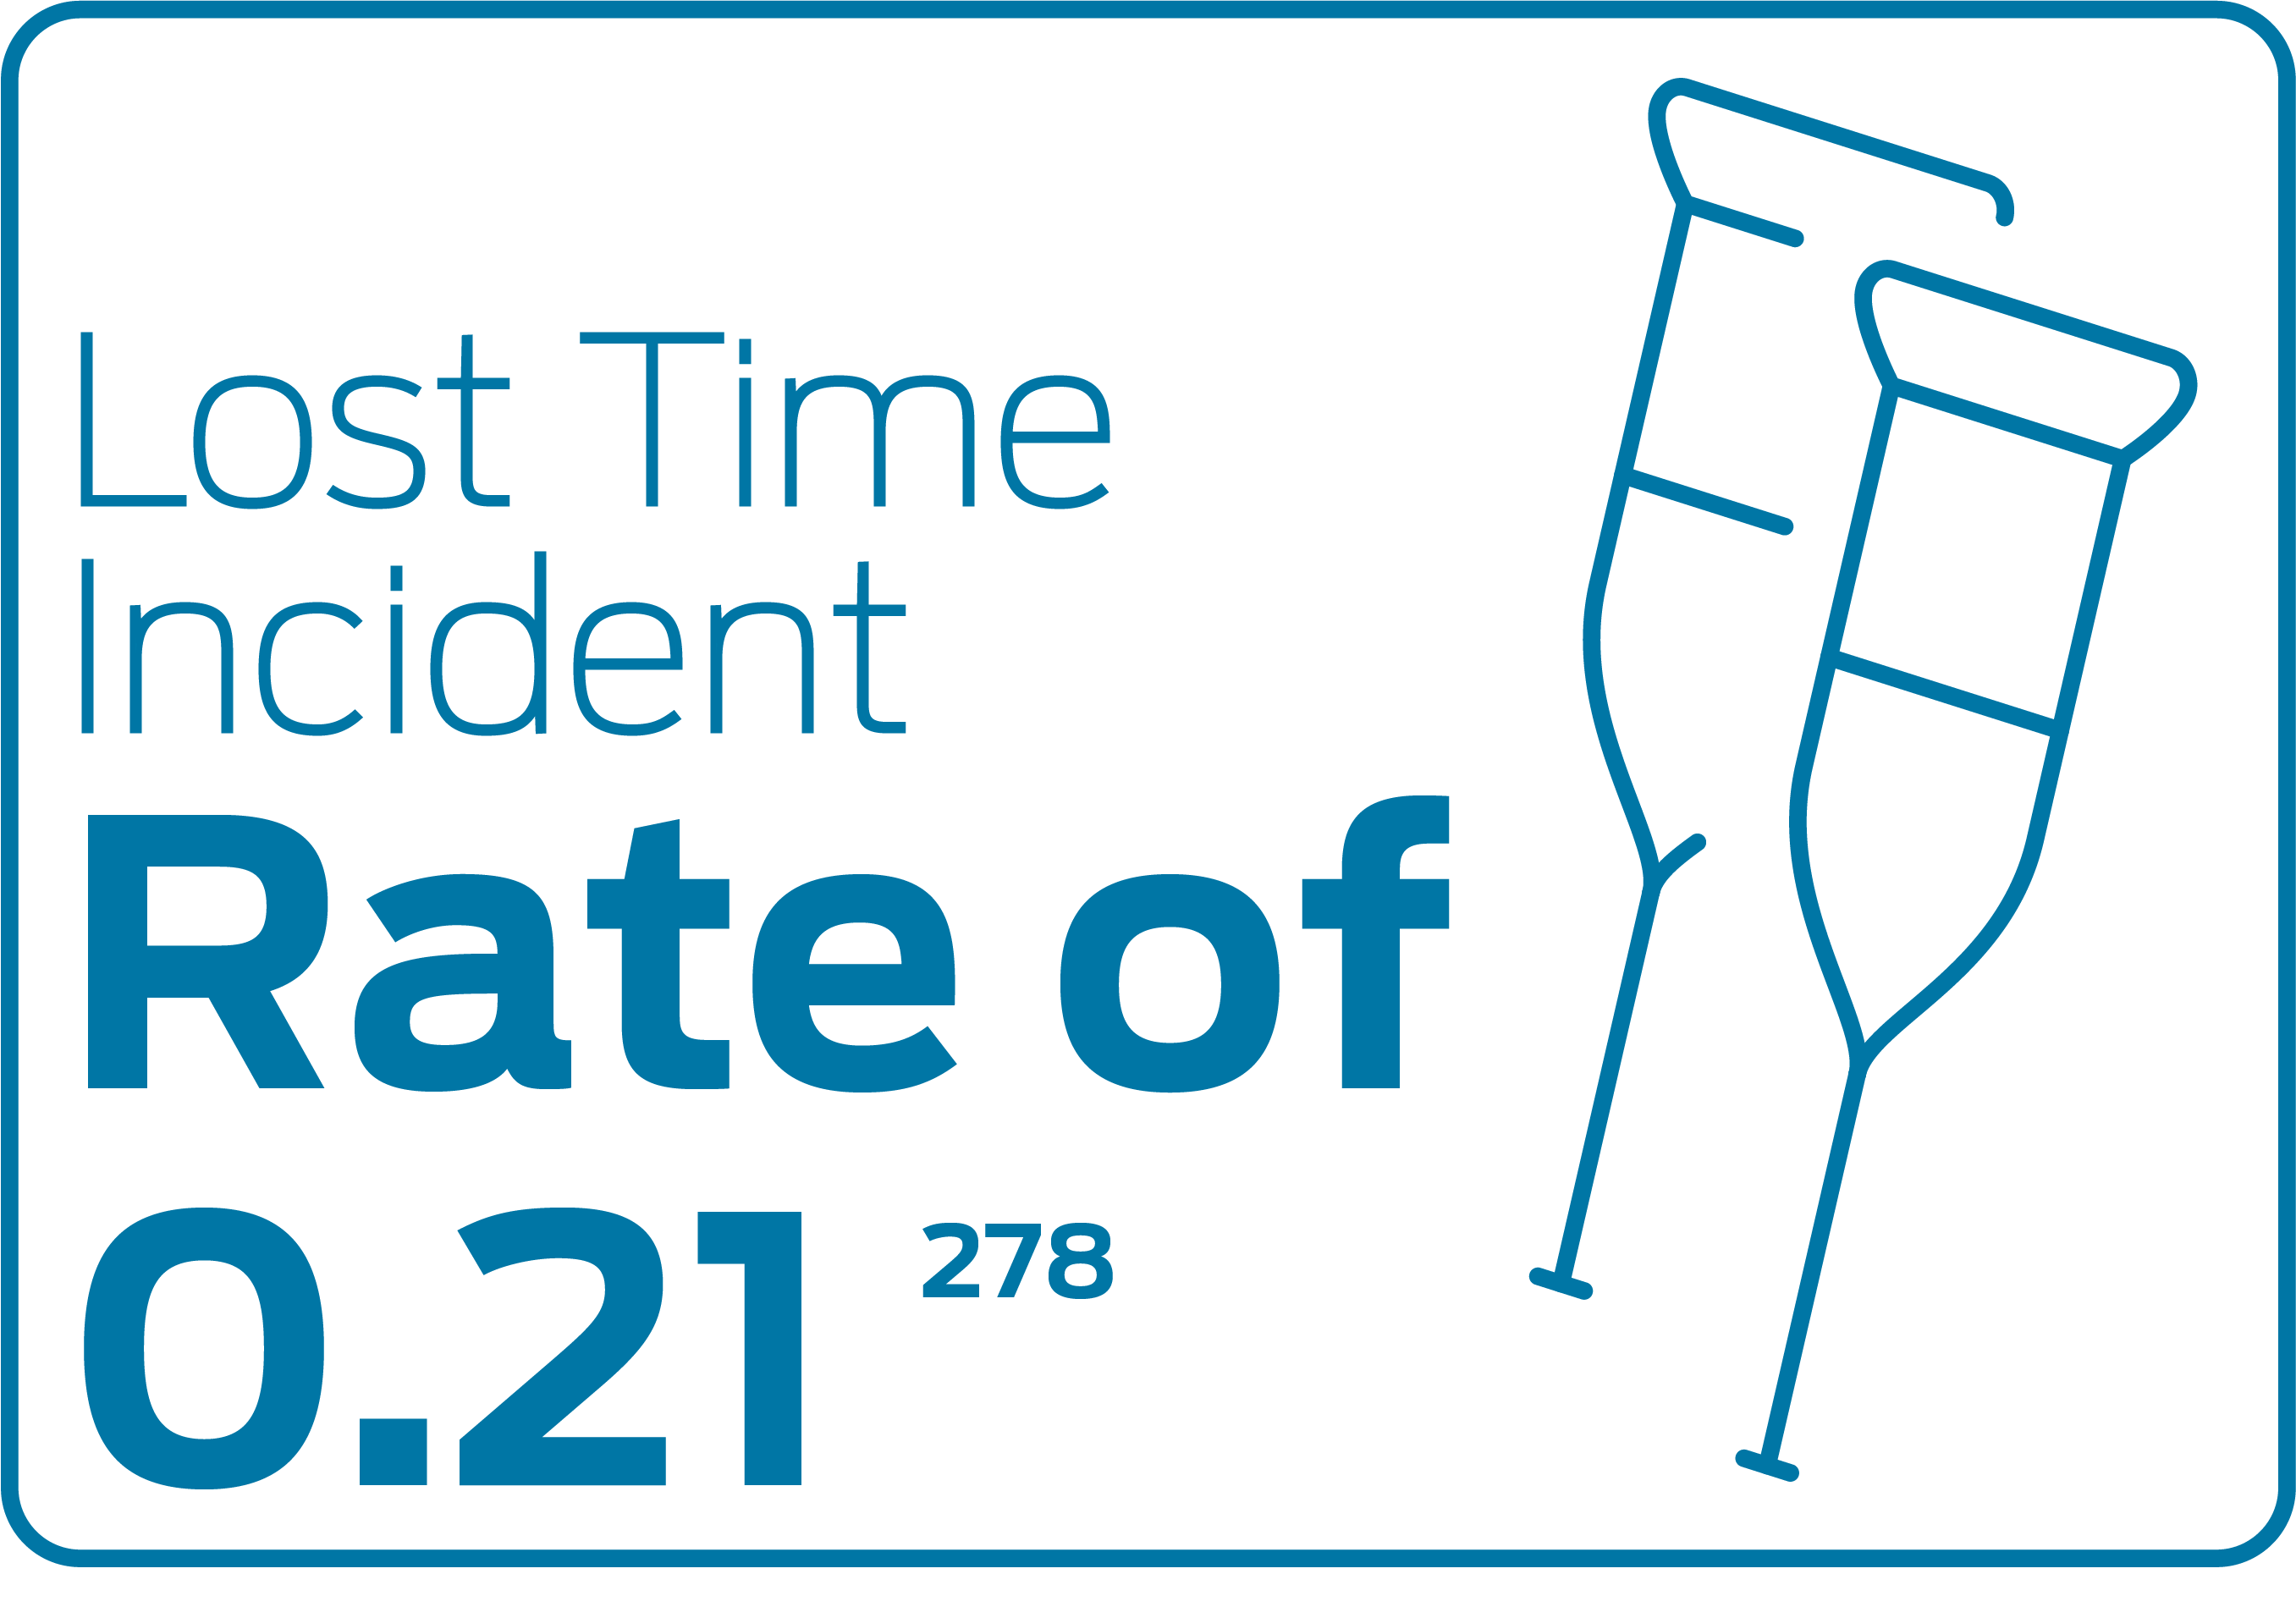
One of Allegion's core values is "Be safe, be healthy." Our top priority for our workers is their physical wellbeing, and we’re proud of the programs we have in place to support this.
In 2024, Allegion had a Lost Time Incident Rate (LTIR) of 0.21. Our teams are actively using valuable internal initiatives like our “Evaluating Your Environment for Safety (EYES)” and “Good Catch” programs to further our culture of safety. Additionally, we are leveraging new technologies, including artificial intelligence (AI), to facilitate risk assessment and mitigation strategies.
2 Data is normalized to hours worked. To the extent actual hours worked are not available for any full-time employee, an average of 40 hours per week is used.
7 Data and metrics associated with the manufacturing and field service activities of Stanley Access Technologies is included in 2024 values (excluding the field service activities of Stanley Access Technologies, LTIR and TRIR were 0.12 and 0.44 for 2024). For 2023, only the manufacturing activities of Stanley Access Technologies are included. Baseline year 2020 has not been adjusted.
8 LTIR and TRIR reflect workplace related incidents as of 31 December of each year presented. Prior year amounts may be updated when incidents are determined to be workplace related in subsequent periods.
Global teams serving Habitat for Humanity
Our communities — and the impact we have on them — matter to us. Each year, Allegion employees dedicate resources and volunteer hours to support local Habitat for Humanity chapters.
Allegion Australia proudly supports Habitat for Humanity Australia through donations and volunteer hours. Employees participate in the Brush With Kindness program throughout the year in Sydney, Brisbane, Melbourne and Adelaide, giving hundreds of hours of their time to help families in crisis.
Allegion Americas is in a $1 million partnership with Habitat for Humanity Mexico through 2027. Since 2016, our facilities in Tijuana, Tecate and Ensenada, Mexico, have donated more than $800,000 U.S. dollars, completing 40 new houses and 31 construction improvement projects for families.
As long-term partners with the Greater Indianapolis Habitat, too, we’ve donated more than $1.8 million and worked on 17 homes as of 2025. Allegion also donates Schlage locks for new homes each year — 434 homes and counting — in addition to supplies products for the organization’s Habitat Restore.
Governance

Independent chairs for board, committees
The Board has an independent chair, separate from the CEO. In addition, all Board committees and committee chairs are independent.

Board of Directors 75% diversity
Effective as of the Annual General Meeting in June 2025, we will have 75% diversity across gender, racial and ethnic representation among our Board of Directors.
When we consider adding members to the Allegion Board of Directors, we take into consideration a broad range of factors — including skills, expertise, business and leadership experience, board experience and viewpoints — that would complement the existing Board and contribute to enhancing the quality of its deliberations and decisions, recognizing that our businesses and operations are diverse and global in nature.
* Effective as of the Annual General Meeting in June 2025
Executive incentive payouts tied to the ESG objectives
As of 2023, a component of annual incentive compensation payouts for our executive leadership team is tied to our company's annual environmental, social and governance (ESG) scorecard performance.
1 GHG emissions calculations previously used a set formula globally. Calculations have been revised for 2020 through 2024 to utilize available location specific grid data.
2 Data is normalized to hours worked. To the extent actual hours worked are not available for any full-time employee, an average of 40 hours per week is used.
3 Actual data is collected for production, assembly and distribution facilities and certain warehouses globally. For all other facilities, data is estimated based on the assumptions below:
- 15 gallons (or 57 liters) of water used per employee per workday.
- 2,700 British Thermal Units of natural gas usage and 1.5 kilowatt hours of electricity usage per square footage per month for office type facilities.
- 2,000 British Thermal Units of natural gas usage and 0.6 kilowatt-hours of electricity per square footage per month for all other facility types.
- 40 pounds (18 kilograms) of non-hazardous waste per employee per month.
4 Data associated with activities not related with production, assembly or distribution are excluded.
5 Data associated with acquisitions is included within values presented starting the year following acquisition.
6 Data associated with the majority of fleet fuel usage has not been included.
7 Data and metrics associated with the manufacturing and field service activities of Stanley Access Technologies is included in 2024 values (excluding the field service activities of Stanley Access Technologies, LTIR and TRIR were 0.12 and 0.44 for 2024). For 2023, only the manufacturing activities of Stanley Access Technologies are included. Baseline year 2020 has not been adjusted.
8 LTIR and TRIR reflect workplace related incidents as of 31 December of each year presented. Prior year amounts may be updated when incidents are determined to be workplace related in subsequent periods.
* Effective as of the Annual General Meeting in June 2025
Allegion conducted a survey with key internal and external stakeholders to help us determine ESG factors of importance to our business and key external stakeholders, including our investors, suppliers, customers and community partners.
Hover or click on each point for more information.
Want to keep this information at your fingertips?
Download the Materiality Matrix.
ESG Newsroom
No matching articles found ...


