- 1
- 2
- 3
Environmental, Social and Governance (ESG)
Explore our Materiality Matrix
Learn more >

Allegion Honored with 2 SEAL Awards for Environmental Initiatives
Learn more >
Environmental, social and governance (ESG) factors are a way to measure how a company affects the world around it. At Allegion, our eight values are at the center of our sustainability efforts and the way we run our business.
Learn more about how Allegion has made steady progress in establishing our ESG commitments and sharing our journey.
ESG at a Glance
Review how Allegion approaches ESG.
Goals & KPIs
Take a look at the goals Allegion has set and the KPIs we are reaching.
Recent progress
Click on our recent milestones below for more information.
Environmental
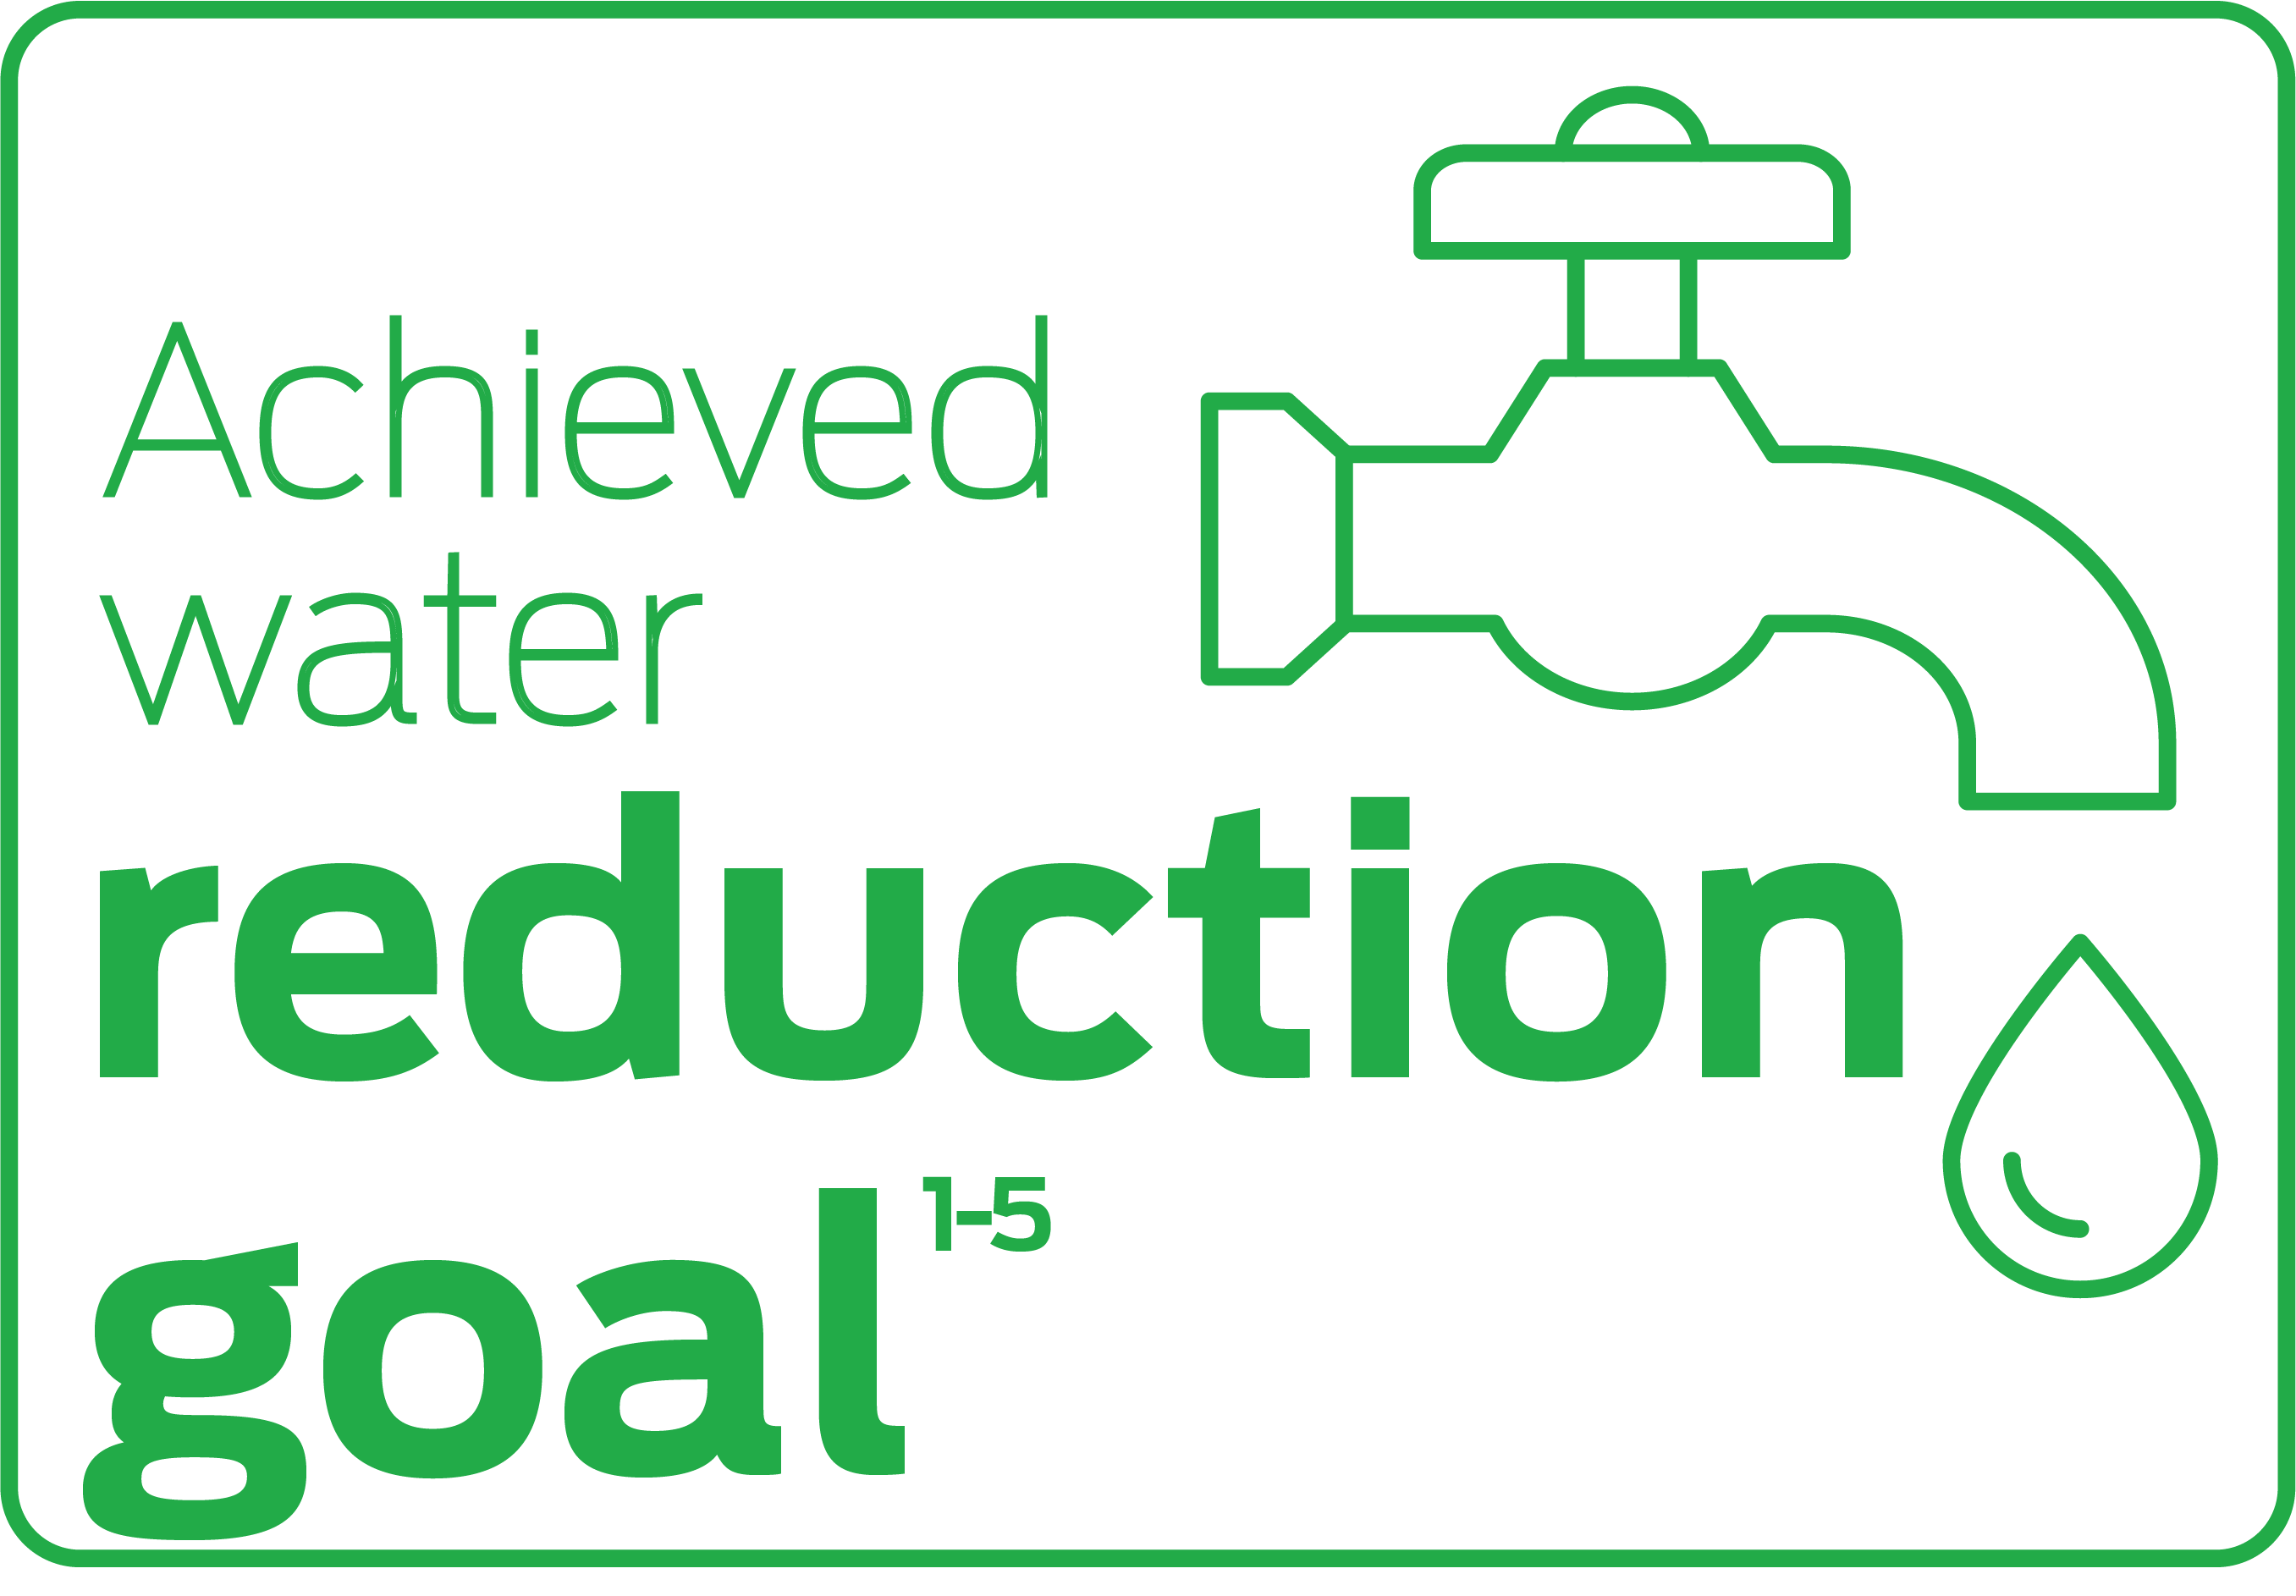
Achieved water reduction goal
As of Dec. 31, 2025, Allegion reduced its water usage intensity by 20% compared to our 2020 baseline year, meeting our goal of using 20% less water than we did in 2020 by 2030.
In our ESG Goals & KPIs section, you’ll find year-over-year data for both normalized data and the actual volume of water used. While volume may vary due to factors such as production output, active hours or the number of sites we operate, normalized data allows us compare "apples-to-apples."
1 Data is normalized to hours worked. To the extent actual hours worked are not available for any full-time employee, an average of 40 hours per week is used.
2 Actual data is collected for most production, assembly, distribution and warehouse facilities globally. For all other facilities, data is estimated based on the assumptions below:
• 15 gallons (or 57 liters) of water used per employee per workday.
• 2,700 British Thermal Units of natural gas usage and 1.5 kilowatt hours of electricity usage per square footage per month for office type facilities.
• 2,000 British Thermal Units of natural gas usage and 0.6 kilowatt hours of electricity per square footage per month for all other facility types.
• 40 pounds (18 kilograms) of non-hazardous waste per employee per month.
3 Data associated with non-routine activities not related with production, assembly or distribution are excluded.
4 Data associated with acquisitions made in 2024 and 2025 is excluded.
5 Data associated with fleet fuel usage has not been included.
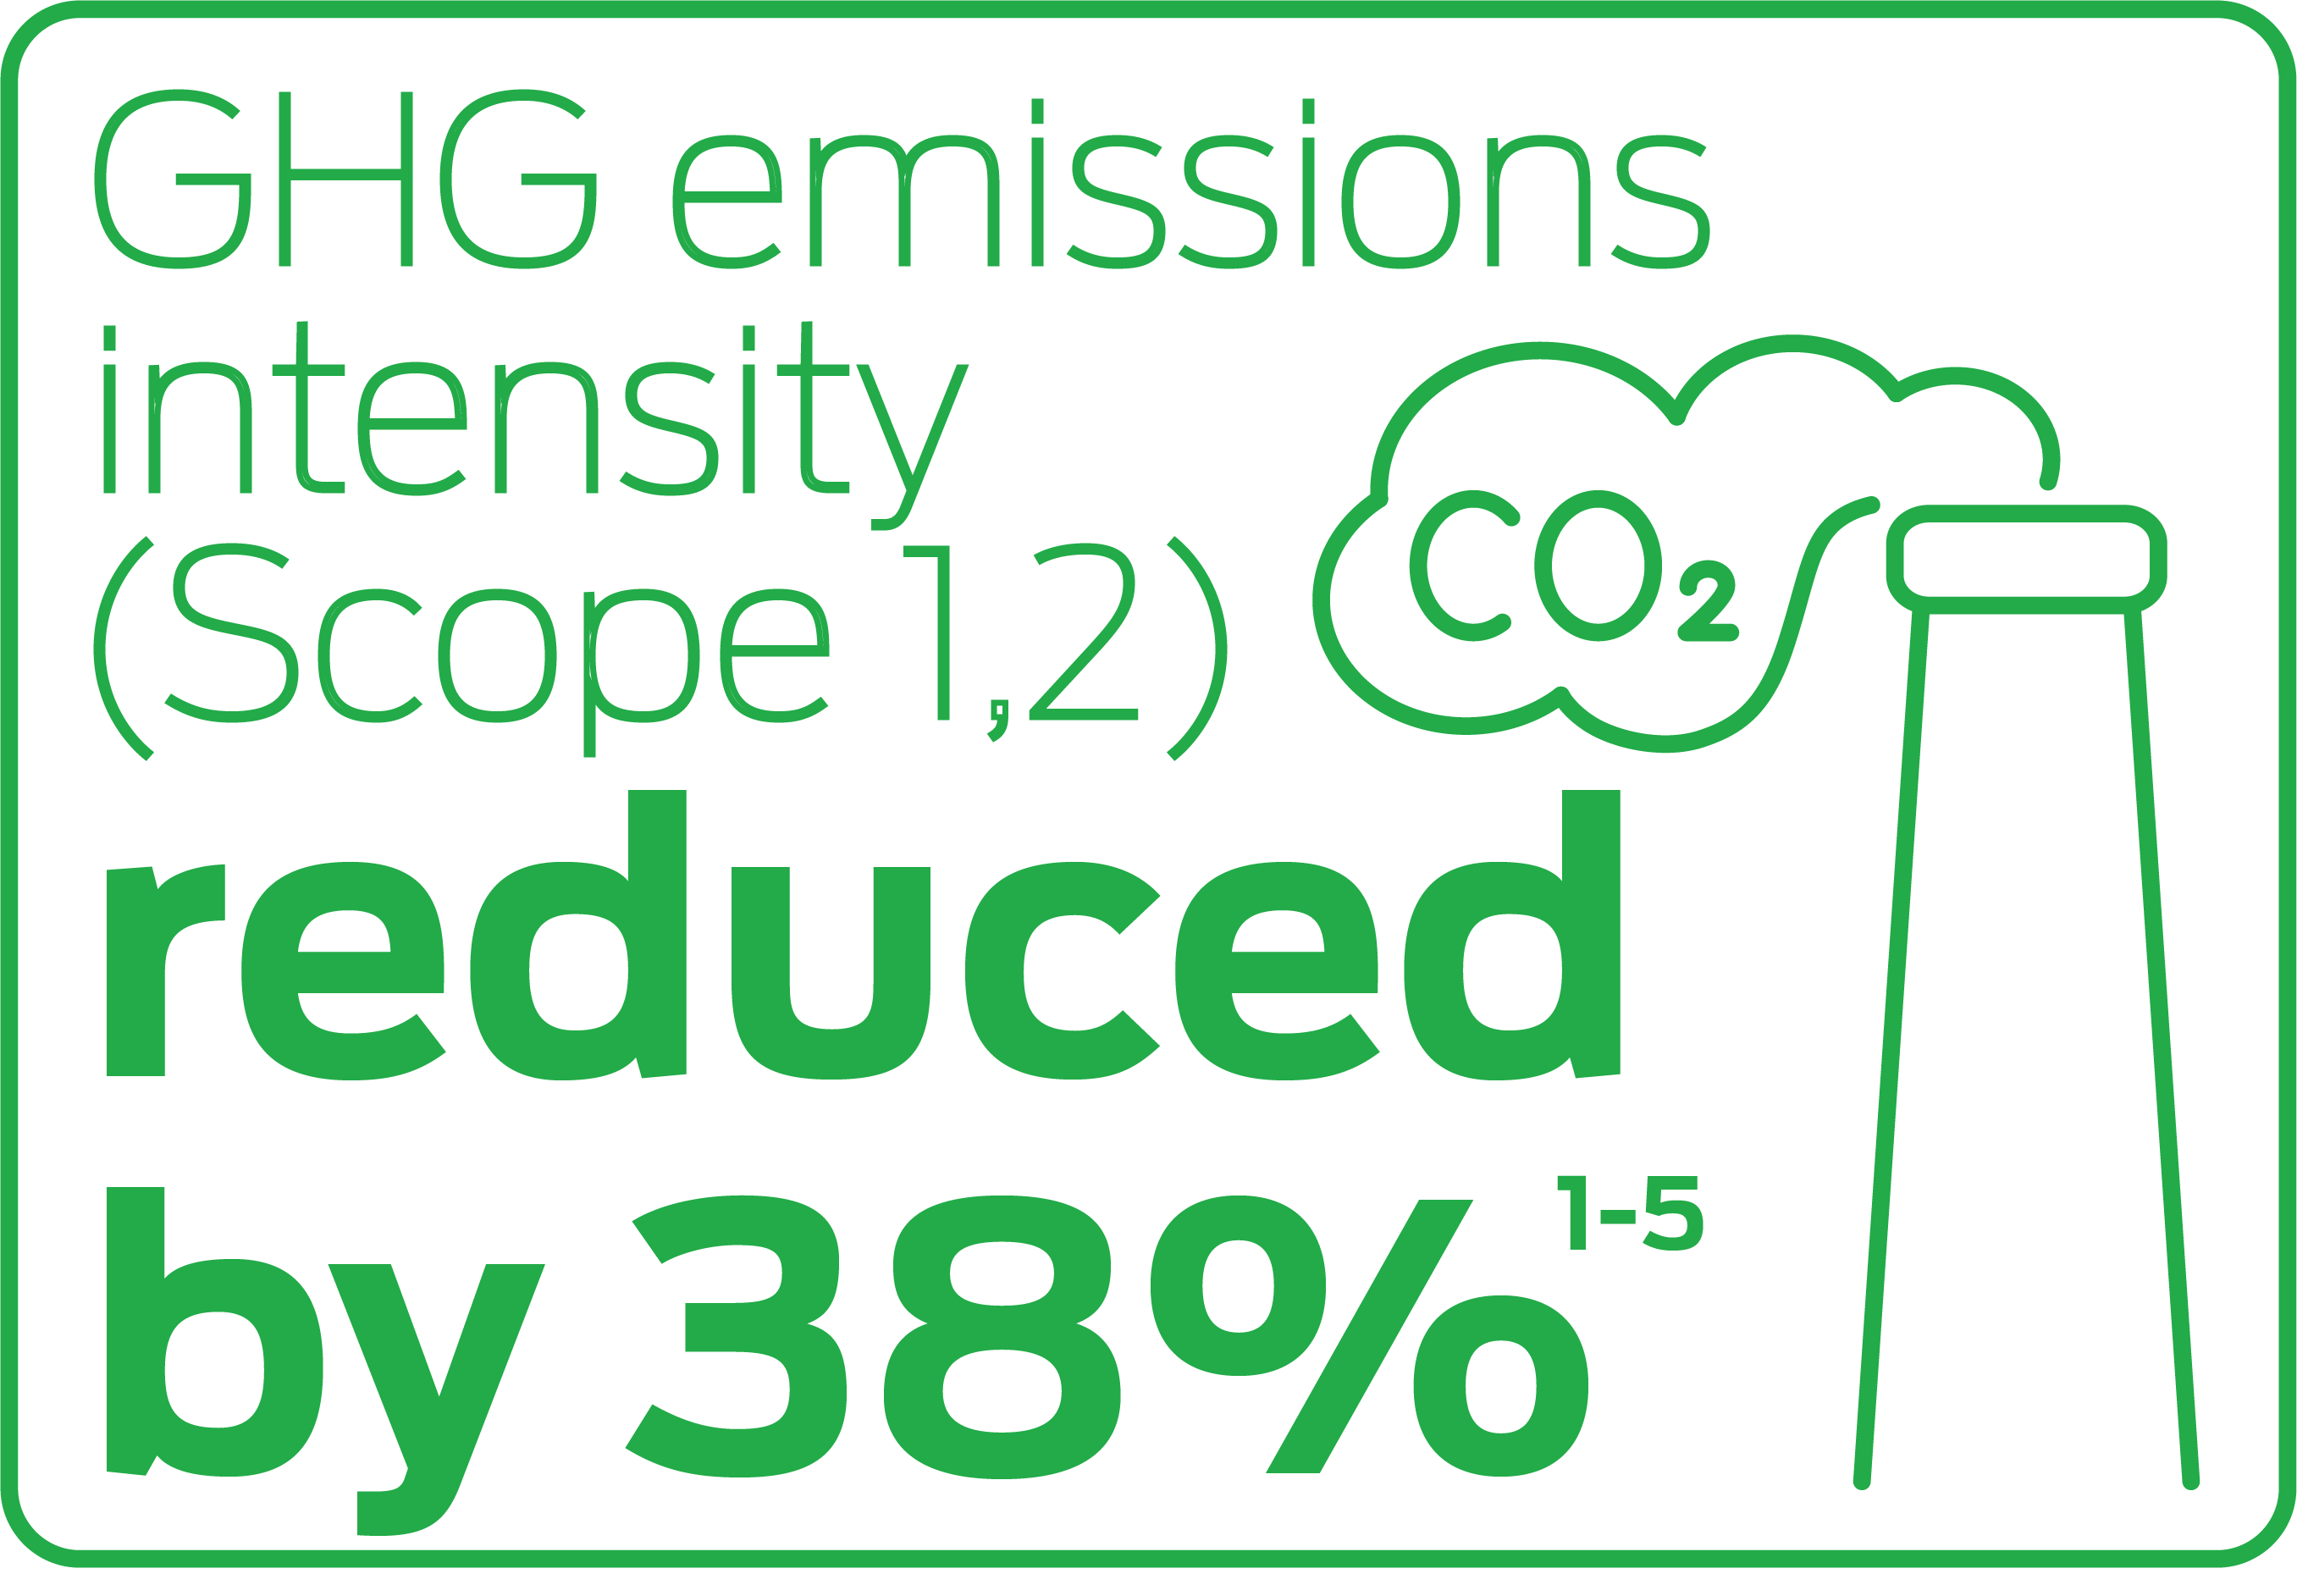
GHG emissions intensity (Scope 1,2) reduced by 38%
As of Dec. 31, 2025, Allegion reduced its greenhouse gas (GHG) emissions intensity (Scope 1 and Scope 2) by 38% compared to our 2020 baseline year. By 2030, we aim to achieve a 40% reduction in GHG emissions intensity for Scope 1 and Scope 2 emissions.
In 2024, Allegion increased its GHG emission intensity (Scope 1 and Scope 2) target from 25% to 40% based on continued improvements in its operations.
1 Data is normalized to hours worked. To the extent actual hours worked are not available for any full-time employee, an average of 40 hours per week is used.
2 Actual data is collected for most production, assembly, distribution and warehouse facilities globally. For all other facilities, data is estimated based on the assumptions below:
• 15 gallons (or 57 liters) of water used per employee per workday.
• 2,700 British Thermal Units of natural gas usage and 1.5 kilowatt hours of electricity usage per square footage per month for office type facilities.
• 2,000 British Thermal Units of natural gas usage and 0.6 kilowatt hours of electricity per square footage per month for all other facility types.
• 40 pounds (18 kilograms) of non-hazardous waste per employee per month.
3 Data associated with non-routine activities not related with production, assembly or distribution are excluded.
4 Data associated with acquisitions made in 2024 and 2025 is excluded.
5 Data associated with fleet fuel usage has not been included.
Waste non-landfill rate 94%
In 2025, Allegion achieved a waste non-landfill rate of 94%. The waste non-landfill rate is an essential metric for evaluating environmental performance because it reflects an organization's commitment to sustainability and resource conservation.
Reducing the amount of waste sent to landfill lowers the environmental impacts of waste disposal, including greenhouse gas emissions, soil and water pollution and depletion of natural resources.
Measuring the share of waste not sent to landfill — including recycling, reuse, recovery and incineration — allows organizations to track progress in reducing landfill disposal and in implementing effective waste-management practices such as source reduction, recycling programs and alternative treatment options. A high non-landfill rate demonstrates a commitment to responsible practices, serves as a useful indicator of environmental performance and can enhance an organization’s reputation and stakeholder trust.
2 Actual data is collected for most production, assembly, distribution and warehouse facilities globally. For all other facilities, data is estimated based on the assumptions below:
• 15 gallons (or 57 liters) of water used per employee per workday.
• 2,700 British Thermal Units of natural gas usage and 1.5 kilowatt hours of electricity usage per square footage per month for office type facilities.
• 2,000 British Thermal Units of natural gas usage and 0.6 kilowatt hours of electricity per square footage per month for all other facility types.
• 40 pounds (18 kilograms) of non-hazardous waste per employee per month.
3 Data associated with non-routine activities not related with production, assembly or distribution are excluded.
4 Data associated with acquisitions made in 2024 and 2025 is excluded.
5 Data associated with fleet fuel usage has not been included.
Social

Named 2026 Gallup exceptional workplace
For the third consecutive year (2024-2026), Allegion has been honored with the prestigious Gallup Exceptional Workplace Award. This award recognizes the most engaged workplace cultures in the world — organizations that achieve more by helping their employees focus on what they do best. Employee engagement — a key factor in organizational achievement — reflects an employee’s commitment to the organization. Engaged employees tend to deliver higher productivity, stay with their organizations longer, have lower absenteeism and experience improved well-being.
New in 2026, Allegion is one of five winners “With Distinction,” recognizing our company’s significant achievements in implementing strategic initiatives to further engagement and help employees thrive, serving as a true best practice example of what’s possible. Gallup found that Allegion continues to set the standard for building a thriving, high-performance culture through an emphasis on team members’ individual strengths, creating an environment where employees feel valued, heard and equipped to do their best work.
The highly competitive award underscores the dedication of Allegion’s 13,000+ full-time employees around the globe. Living our core values and taking ownership of engagement helps accelerate Allegion’s success and advance our vision of creating a safer and more accessible world.

Achieved employee engagement in top quartile
Employee engagement, which measures an employee's commitment to their organization, is a critical driver of success. Engaged employees deliver higher productivity, stay with their organizations longer, experience lower absenteeism and enjoy improved well-being.
As of 2026, Allegion has achieved our goal of scoring among the top 25% companies with the highest Gallup Q12 employee engagement scores in the Gallup‡ database. The survey, a globally recognized tool for assessing engagement, uses 12 focused questions to evaluate key aspects of engagement, identifying unmet employee needs and providing actionable insights. The GrandMean score, which averages responses across the 12 items on a 5.00 scale, serves as a vital benchmark for overall engagement.
At Allegion, we are committed to fostering a workplace environment that enables our employees to thrive, empowering them to deliver exceptional solutions to our customers.
‡ Percentiles are based on Gallup’s Q12 Overall Company Level Database from the survey year. GALLUP is a registered trademark of Gallup, Inc. and the property of its owner.
Global teams serving Habitat for Humanity
Guided by Allegion’s core value, “Serve others, not yourself,” service is at the heart of Allegion’s culture. Our communities — and the impact we have on them — matter to us. Each year, employees around the world supported local organizations and initiatives through donations, engagement and countless volunteer hours to support local Habitat for Humanity chapters.
Allegion Australia proudly supports Habitat for Humanity Australia through donations and volunteer hours. Employees participate in the Brush With Kindness program throughout the year, an initiative aimed at assisting homeowners who struggle to maintain the exterior of their homes, ensuring families live in safe and well-maintained homes.
Allegion Americas is in a $1 million partnership with Habitat for Humanity Mexico through 2027. Since 2016, our facilities in Tijuana, Tecate and Ensenada, Mexico, have donated more than $800,000 U.S. dollars, completing 40 new houses and 31 construction improvement projects for families. In April 2025, our Allegion’s Ensenada, Mexico, team had the special opportunity to help build a colleague’s home in Ensenada. Together, they poured over 50 square meters of concrete.
For 17 years, Allegion has partnered with Greater Indy Habitat for Humanity to serve the Indianapolis community near our Americas headquarters in Carmel, Indiana. Since 2009, Allegion has contributed $1.9 million, volunteered approximately 26,091 hours and donated $387,088 worth of products to the Habitat ReStore, supporting the construction of 479 homes and counting in the Greater Indianapolis area.
In 2025, Allegion completed our 11th panel build in the Allegion parking lot, helping complete our 17th home with Greater Indy Habitat. This was especially exciting with the launch of Devon Creek, Greater Indy Habitat’s first full-scale subdivision development in Marion County in 25 years. Allegion proudly serves as the future builder sponsor for this project, which will provide 10 affordable homes to first-time homebuyers — addressing the critical shortage of affordable housing. Learn more about this initiative here.
Governance

Independent chairs for board, committees
The Board has an independent chair, separate from the CEO. In addition, all Board committees and committee chairs are independent.

Board of Directors 75% diversity
We have 75% diversity across gender, racial and ethnic representation among our Board of Directors.
When we consider adding members to the Allegion Board, we take into consideration a broad range of factors — including skills, expertise, business and leadership experience, board experience and viewpoints — that would complement the existing Board and contribute to enhancing the quality of its deliberations and decisions, recognizing that our businesses and operations are diverse and global in nature.

No direct corporate political donations
No direct corporate political donations have been made over the past nine years (2017-2025) on behalf of Allegion, and we do not have a political action committee.
1 Data is normalized to hours worked. To the extent actual hours worked are not available for any full-time employee, an average of 40 hours per week is used.
2 Actual data is collected for most production, assembly, distribution and warehouse facilities globally. For all other facilities, data is estimated based on the assumptions below:
• 15 gallons (or 57 liters) of water used per employee per workday.
• 2,700 British Thermal Units of natural gas usage and 1.5 kilowatt hours of electricity usage per square footage per month for office type facilities.
• 2,000 British Thermal Units of natural gas usage and 0.6 kilowatt hours of electricity per square footage per month for all other facility types.
• 40 pounds (18 kilograms) of non-hazardous waste per employee per month.
3 Data associated with non-routine activities not related with production, assembly or distribution are excluded.
4 Data associated with acquisitions made in 2024 and 2025 is excluded.
5 Data associated with fleet fuel usage has not been included.
Allegion conducted a survey with key internal and external stakeholders to help us determine ESG factors of importance to our business and key external stakeholders, including our investors, suppliers, customers and community partners.
Hover or click on each point for more information.


Want to keep this information at your fingertips?
Download the Materiality Matrix.


